



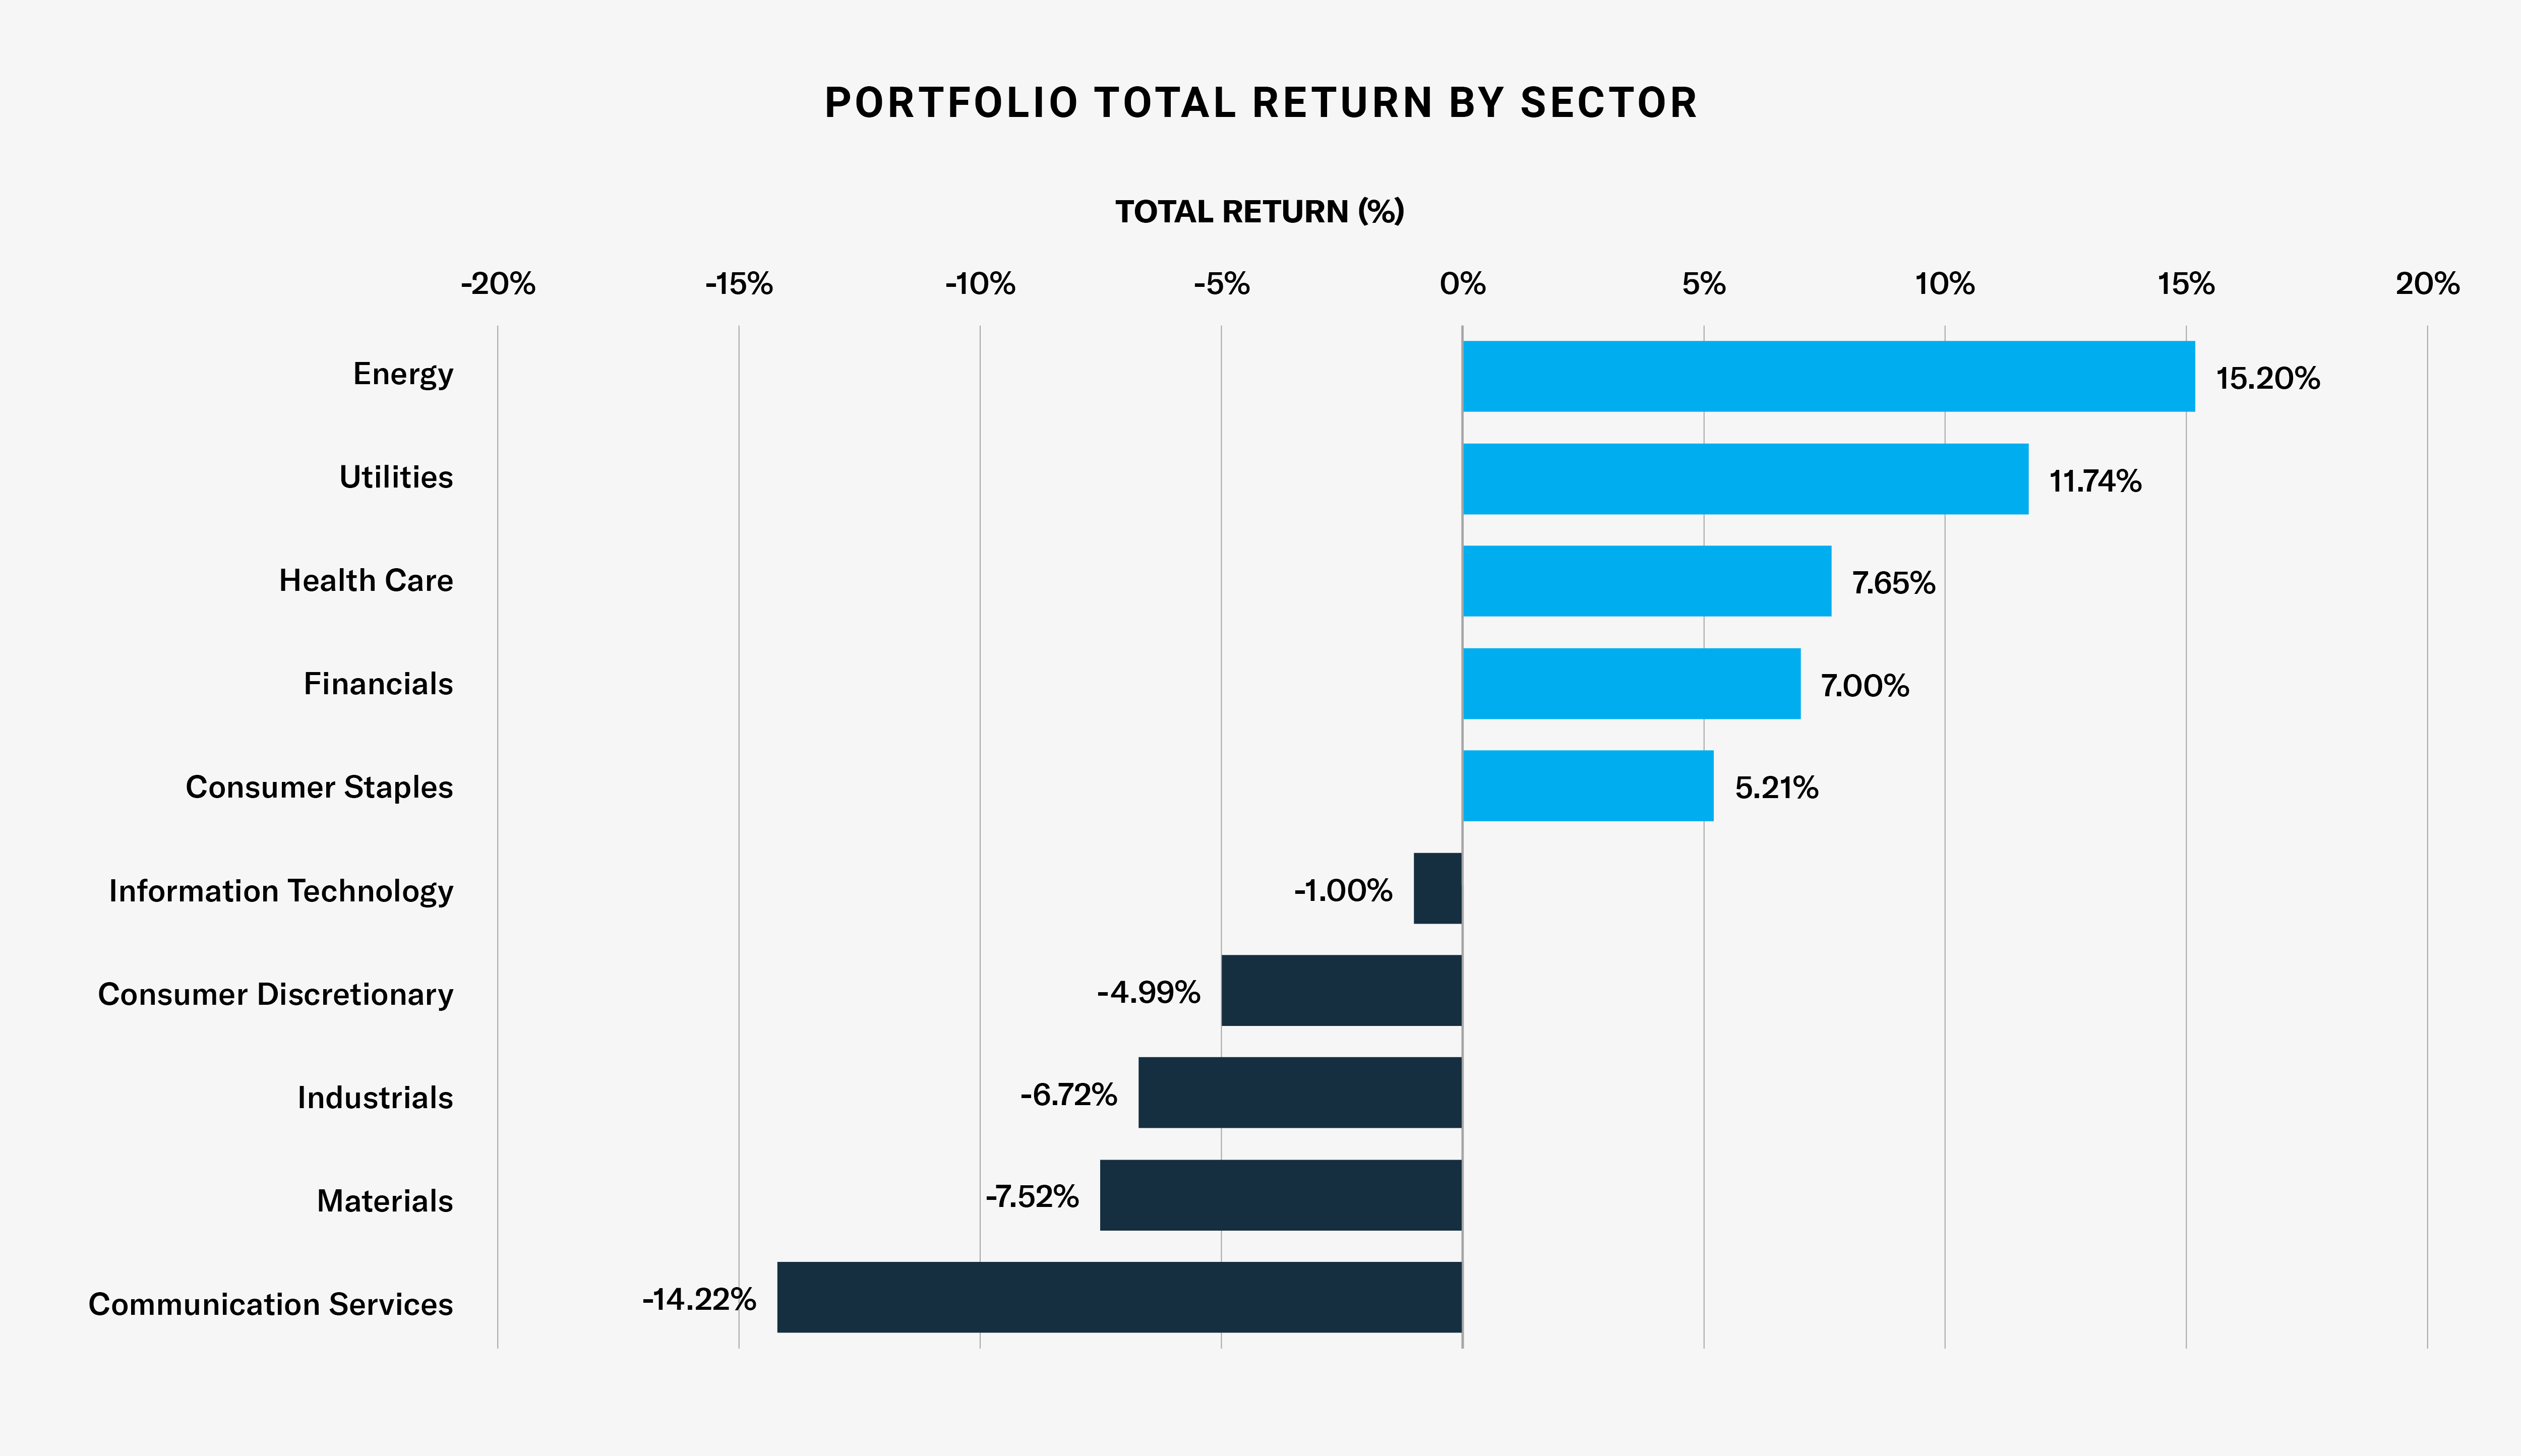
During October, the Amplify CWP Enhanced Dividend Income ETF (DIVO) returned 2.26% (NAV), compared with -0.87% for its benchmark, the S&P 500 Index. Year to date, the Fund has returned 10.70%, compared with 11.77% for the Index. DIVO’s relative strength during the month was supported by strong security selection and its focus on high-quality, dividend-paying companies. The benefits of this approach were particularly evident within Information Technology. DIVO has historically maintained a lower allocation to the sector than the broader market, which helped insulate the Fund from some of the volatility experienced during the month. Importantly, the benefit extended beyond sector allocation, as DIVO’s Information Technology holdings also held up better than the sector within the benchmark. This highlighted the role that security selection and an emphasis on quality can play, even within areas of the market facing broader pressure.
Financials (+7.00%), Health Care (+7.65%), and Energy (+15.20%) were the strongest contributing sectors during the month, while Industrials (-6.72%) and Communication Services (-14.22%) detracted from returns.1 Visa Inc. (V), Chevron Corp. (CVX), and Amgen Inc. (AMGN) were the top individual contributors, while Caterpillar Inc. (CAT) and Alphabet Inc. (GOOGL) were the primary detractors.
During October, new positions were initiated in AbbVie (ABBV) and Booking Holdings (BKNG). ABBV returned to double-digit revenue and earnings growth while delivering margin expansion, strong free cash flow, and 30%+ returns on invested capital. ABBV also offers a roughly 2.5% dividend yield with consistent historical dividend growth. BKNG was added as shares reached their lowest valuation levels since 2020, despite continued double-digit revenue and earnings growth, 25%+ net margins, and strong free cash flow generation. The company has also used the lower share price to accelerate buybacks, repurchasing nearly $8 billion of stock over the past two quarters. The Fund exited its positions in TJX Companies (TJX) and Walmart (WMT). The Fund was also active in writing covered calls amid increased market volatility, finishing the month with an options overlay on six positions, covering approximately 14.55% of the portfolio.2
The performance data quoted represents past performance and does not guarantee future results. Investment return and principal value of an investment will fluctuate so that an investor’s shares, when sold or redeemed, may be worth more or less than the original cost. Current performance may be lower or higher than the performance quoted. For most recent month-end performance, visit DIVOETF.com.
YIELD
| Distribution Frequency: Monthly |
Distribution Rate: 4.85% |
30-Day SEC Yield: 1.35% |
Distribution Rate is the normalized current distribution (annualized) over NAV per share. Distributions may include income, capital gains, or return of capital and may vary during the year, details in the Fund’s Form 19(a)-1. There is no guarantee the ETF will pay a distribution. 30-Day SEC Yield is a standard yield calculation developed by the Securities and Exchange Commission that allows for fairer comparisons among bond funds. It is based on the most recent month end. This figure reflects the income earned from dividends – excluding option income – during the period after deducting the Fund’s expenses for the period.
PERFORMANCE
| MONTH END AS OF 10/31/2026 |
CUMULATIVE (%) | ANNUALIZED (%) | |||||
|---|---|---|---|---|---|---|---|
| 1 Mo. | YTD | Since Inception |
1 Yr. | 3 Yr. | 5 Yr. | Since Inception |
|
| NAV | 2.26% | 10.70% | 221.52% | 12.74% | 17.57% | 10.55% | 12.54% |
| Closing Price | 2.22% | 10.70% | 221.25% | 12.54% | 17.59% | 10.53% | 12.54% |
| S&P 500 TR Index | -0.87% | 11.77% | 292.16% | 12.11% | 23.40% | 12.06% | 14.83% |
| QUARTER END AS OF 9/30/2026 |
CUMULATIVE (%) | ANNUALIZED (%) | |||||
|---|---|---|---|---|---|---|---|
| 1 Mo. | YTD | Since Inception |
1 Yr. | 3 Yr. | 5 Yr. | Since Inception |
|
| NAV | -3.34% | 8.25% | 214.42% | 11.43% | 16.38% | 11.55% | 12.40% |
| Closing Price | -3.34% | 8.30% | 214.28% | 11.41% | 16.32% | 11.50% | 12.40% |
| S&P 500 TR Index | -0.35% | 12.75% | 295.60% | 15.74% | 22.89% | 13.79% | 15.07% |
Fund inception date: 12/13/2016. DIVO’s total expense ratio is 0.56%. The performance data quoted represents past performance and does not guarantee future results. Investment return and principal value of an investment will fluctuate so that an investor's shares, when sold or redeemed, may be worth more or less than the original cost. Current performance may be lower or higher than the performance quoted. For most recent month-end performance, visit AmplifyETFs.com/DIVO. Brokerage commissions will reduce returns. NAV is the sum of all its assets less any liabilities, divided by the number of shares outstanding. The closing price is the last price at which the fund traded.
SECTORS
| % Wt. | |
|---|---|
| Financials | 27.30% |
| Information Technology | 17.85% |
| Health Care | 16.03% |
| Industrials | 13.16% |
| Energy | 7.00% |
| Materials | 5.92% |
| Consumer Staples | 4.64% |
| Consumer Services | 4.36% |
| Utilities | 2.57% |
| Consumer Discretionary | 1.17% |
TOP 10 HOLDINGS
| Ticker | Name | % Wt. |
|---|---|---|
| MSFT | Microsoft Corp | 5.91% |
| AMGN | Amgen Inc. | 5.64% |
| V | Visa Inc. | 5.35% |
| AAPL | Apple Inc. | 5.10% |
| GS | Goldman Sachs Group Inc. | 5.03% |
| JPM | JPMorgan Chase & Co. | 5.00% |
| CAT | Caterpillar Inc. | 4.65% |
| AXP | American Express Co | 4.15% |
| CVX | Chevron Corp | 4.01% |
| NVDA | Nvidia Corp. | 3.95% |
HOLDINGS RETURNS
| Top Contributors | Total Return | Top Detractors | Total Return |
|---|---|---|---|
| Chevron Corp. (CVX) | +15.33% | Caterpillar Inc. (CAT) | -23.01% |
| Visa Inc. (V) | +15.10% | Alphabet Inc. (GOOGL) | -18.67% |
| Amgen Inc. (AMGN) | +10.56% | NVIDIA Corp. (NVDA) | -10.39% |
SECTOR RETURNS
All data as of 10/31/2026. Subject to change at any time. Fund holdings should not be considered recommendations to buy or sell any security. View Current Complete Holdings.