



International equities fell for a second straight month in October. The MSCI ACWI ex USA Index declined approximately -2.81%, ending the month nearly 7% below its early September all-time high and below its 200-day moving average. Emerging markets lagged, falling roughly 6.6%. Most of that decline came from Taiwan and South Korea, where concerns about slower AI and data center spending hit major semiconductor names. Brazil is a small part of the index but saw sharp swings around its presidential election. Geopolitical risk remained in focus as the Iran conflict escalated, pushing oil prices up nearly 14.5% during the month. The U.S. dollar strengthened, which also pressured international equities. Gold weakened, which we believe reflected risk-off sentiment more than any change in fundamentals. The interest rate pressure that marked September began to ease. European bond yields appeared to peak in the first days of October and ended the month down about 0.26%, giving international markets some support. In the U.S., the Federal Reserve’s October meeting reinforced views of policy stability and credibility, which helped to keep a lid on global bond yields.
Third-quarter earnings season kicked off in October, and early results show solid earnings growth across Europe and Asia. European banks showed that profitability is holding up despite higher interest rates. Looking ahead, we view the outcome of the U.S. midterm elections as favorable for international markets. Lower oil prices tied to a potential ceasefire with Iran and a weaker U.S. dollar could also provide support. Earnings momentum has been a theme all year and continues, with consensus 12-month forward earnings growth of approximately 15% in Europe and higher in emerging markets. Our bottom-up outlook remains constructive. We continue to favor long-term themes, including deregulation, AI and technology infrastructure “picks and shovels” companies, and dependable dividend payers such as Unilever PLC (UL) and British American Tobacco (BTI). We believe IDVO remains well positioned to capture opportunities across international markets through a combination of high-conviction stock selection and an income-oriented covered call strategy.1
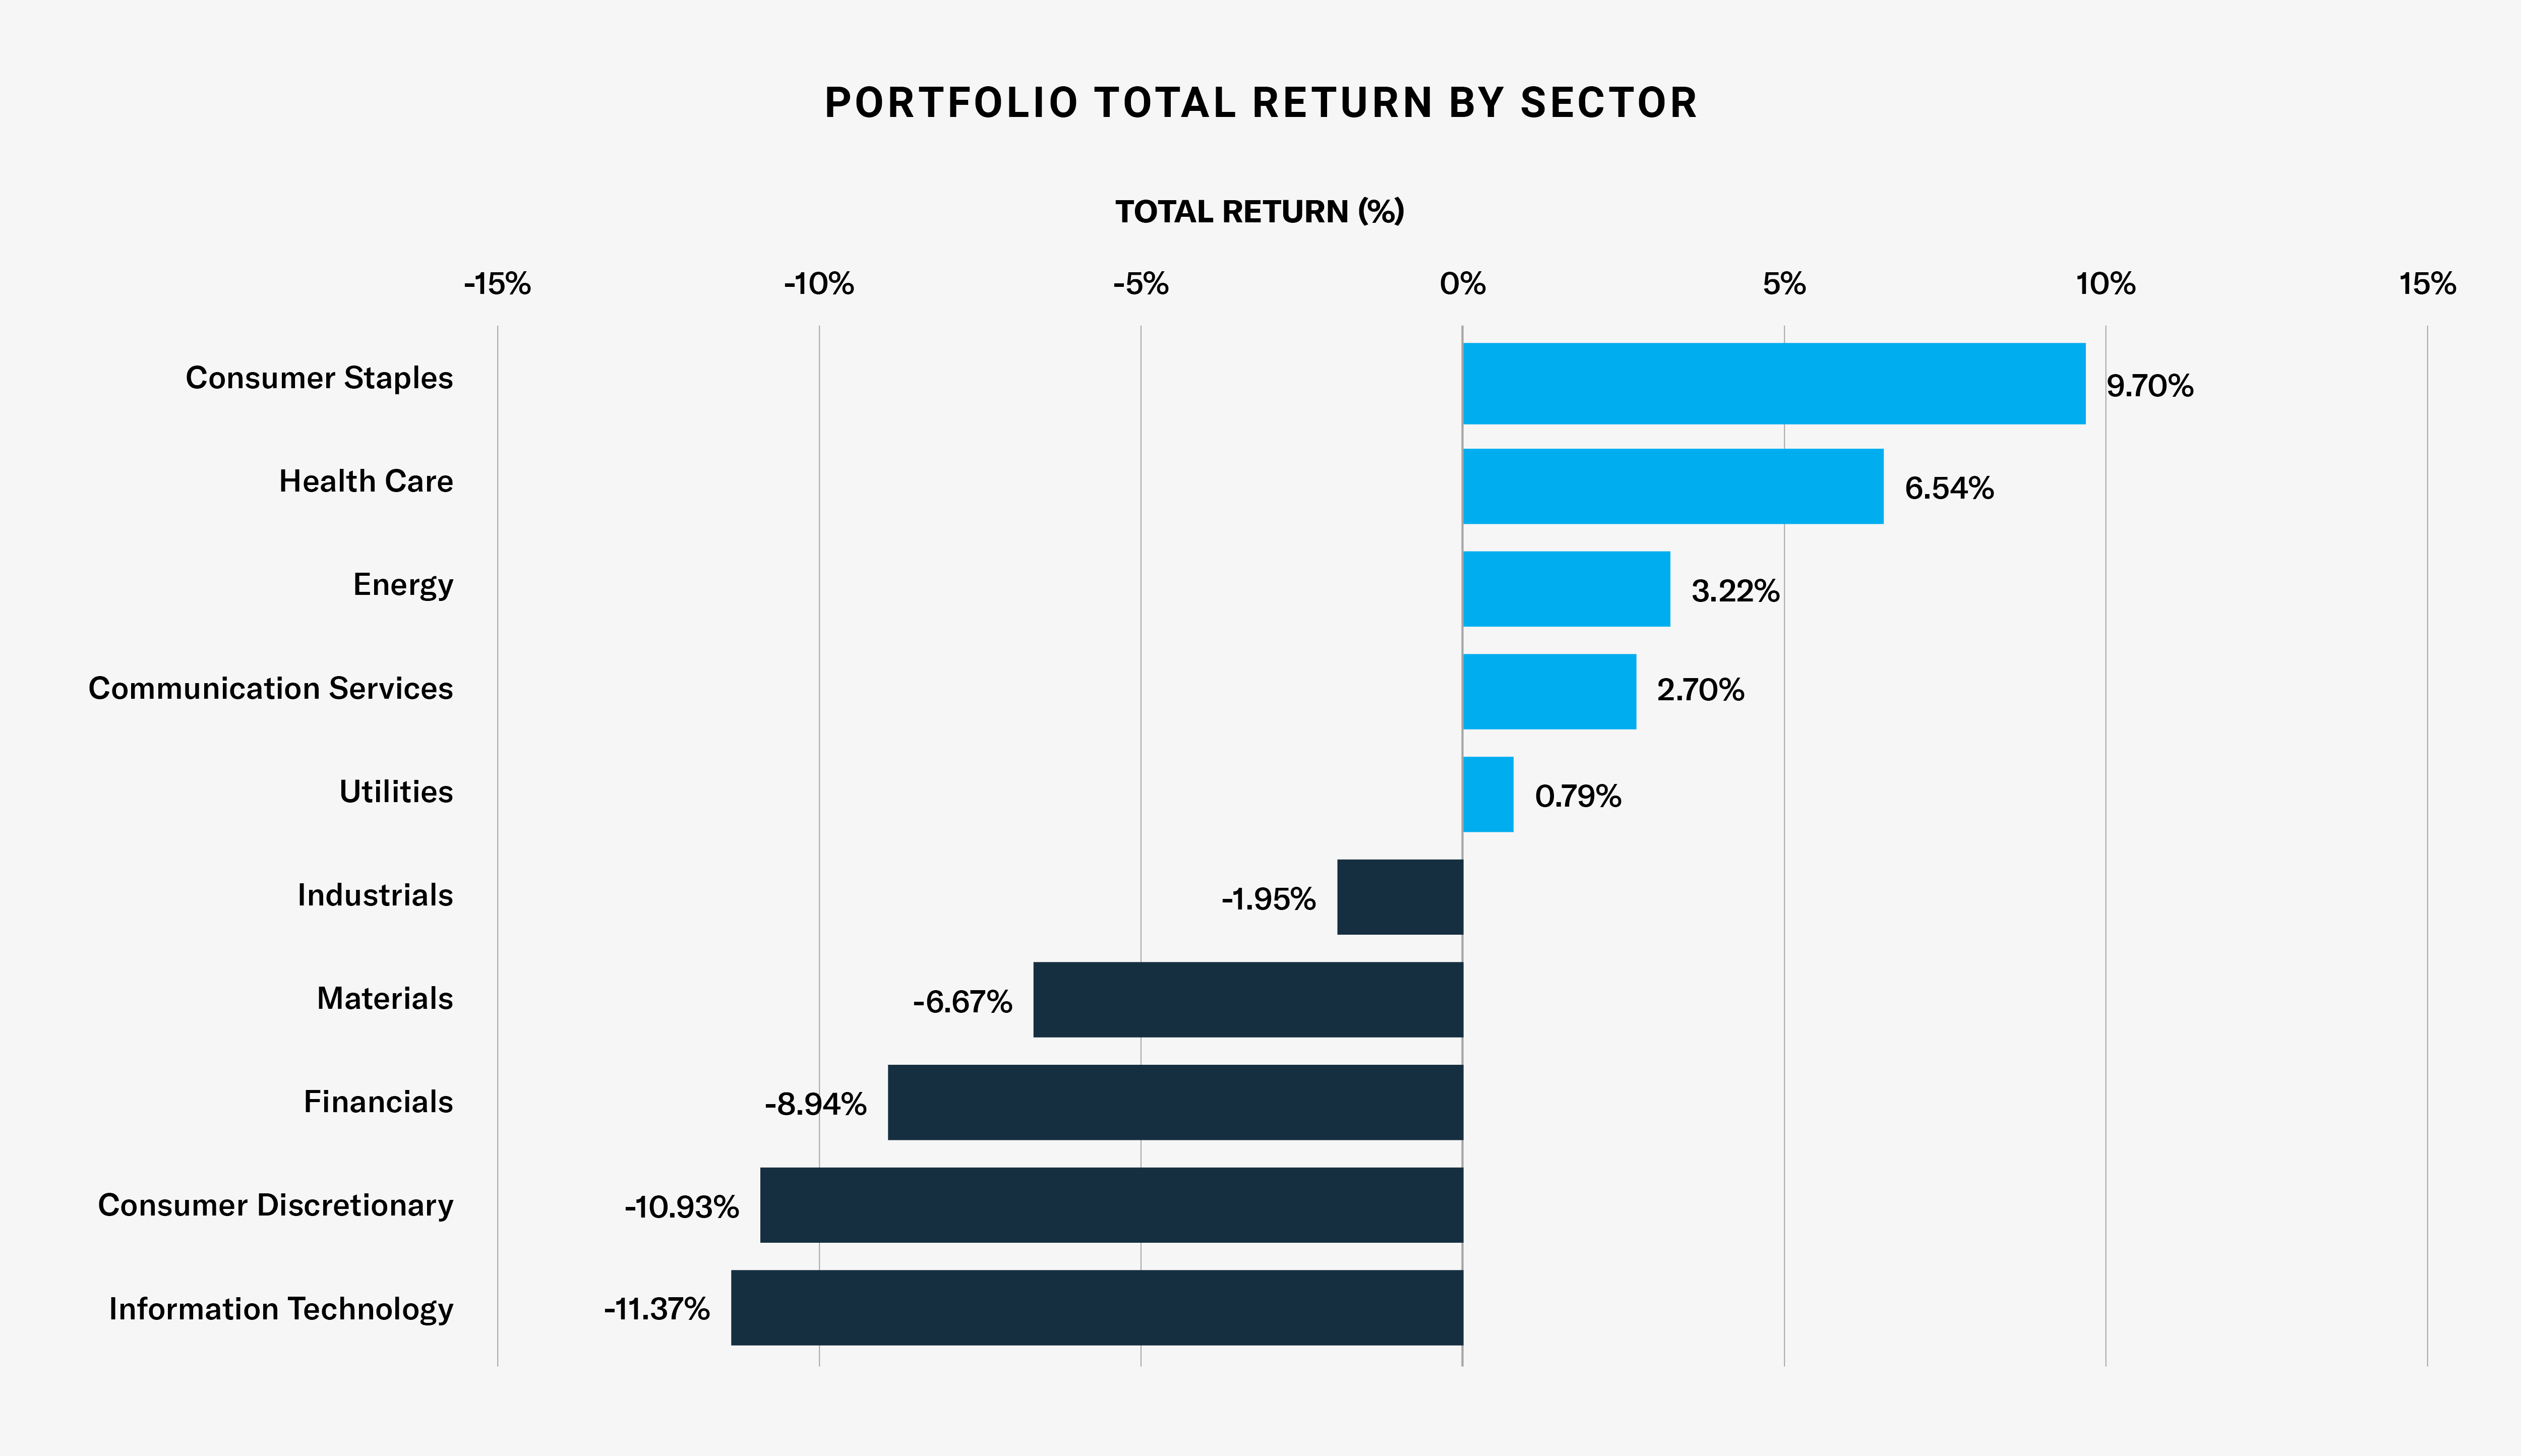
During October, Amplify CWP International Enhanced Dividend Income ETF (IDVO) returned -4.04% (NAV), underperforming the MSCI ACWI ex USA Index, which returned -2.81%. Year-to-date, the Fund has returned 8.81% (NAV) versus 11.01% for the benchmark. In terms of sectors, Consumer Staples and Health Care were the largest contributors to relative performance, while Information Technology, Consumer Discretionary, and Financials were the largest detractors. On an absolute basis, Consumer Staples (+9.70%) and Health Care (+6.54%) were the strongest sectors, while Information Technology (-11.37%) and Consumer Discretionary (-10.93%) weighed on returns.2 Sasol Ltd. (SSL), British American Tobacco Plc (BTI), and Imperial Oil Ltd. (IMO) were the top contributors, while Taiwan Semiconductor (TSM) and SK Hynix Inc. (SKHY) were the largest detractors. Relative performance was mainly held back by a few Financials holdings that weakened after the Brazilian election results discussed above. The Fund benefited from overweight positions in Energy and Consumer Staples, and a slight underweight position in Information Technology helped limit the impact of that sector’s decline.
Looking ahead, the Fund remains overweight Financials, with a focus on banks we believe are being rerated globally, particularly in Europe and Japan. The Fund also continues to hold long-term exposure to Materials and natural resources, including copper, gold, and silver. In Technology, we favor semiconductor and AI infrastructure beneficiaries, including Taiwan Semiconductor (TSM), ASE Technology Holding (ASX), ASML Holding (ASML), and select European “picks and shovels” companies. Consumer Staples and companies that generate strong free cash flow, such as British American Tobacco (BTI) and Unilever PLC (UL), remain core positions.
The performance data quoted represents past performance and does not guarantee future results. Investment return and principal value of an investment will fluctuate so that an investor’s shares, when sold or redeemed, may be worth more or less than the original cost. Current performance may be lower or higher than the performance quoted. For most recent month-end performance, visit IDVOETF.com.
YIELD
| Distribution Frequency: Monthly |
Distribution Rate: 6.13% |
30-Day SEC Yield: 1.47% |
Distribution Rate is the normalized current distribution (annualized) over NAV per share. Distributions may include income, capital gains, or return of capital and may vary during the year, details in the Fund’s Form 19(a)-1. There is no guarantee the ETF will pay a distribution. 30-Day SEC Yield is a standard yield calculation developed by the Securities and Exchange Commission that allows for fairer comparisons among bond funds. It is based on the most recent month end. This figure reflects the income earned from dividends – excluding option income – during the period after deducting the Fund’s expenses for the period.
PERFORMANCE
| MONTH END AS OF 10/31/2026 |
Cumulative (%) | Annualized (%) | ||||
|---|---|---|---|---|---|---|
| 1 Mo. | YTD | Since Inception |
1 Yr. | 3 Yr. | Since Inception |
|
| NAV | -4.04% | 8.81% | 103.46% | 11.63% | 21.97% | 18.68% |
| Closing Price | -4.06% | 8.73% | 103.57% | 11.59% | 22.00% | 18.69% |
| MSCI ACWI ex USA Index | -2.81% | 11.01% | 90.42% | 14.31% | 21.09% | 16.80% |
| QUARTER END AS OF 9/30/2026 |
Cumulative (%) | Annualized (%) | ||||
|---|---|---|---|---|---|---|
| 1 Mo. | YTD | Since Inception |
1 Yr. | 3 Yr. | Since Inception |
|
| NAV | -1.99% | 13.38% | 112.02% | 18.36% | 22.88% | 20.32% |
| Closing Price | -1.97% | 13.33% | 112.19% | 18.31% | 22.93% | 20.34% |
| MSCI ACWI ex USA Index | -2.38% | 14.22% | 95.93% | 20.00% | 20.54% | 18.00% |
Fund inception date: 09/07/2022. IDVO’s total expense ratio is 0.65%. The performance data quoted represents past performance and does not guarantee future results. Investment return and principal value of an investment will fluctuate so that an investor's shares, when sold or redeemed, may be worth more or less than the original cost. Current performance may be lower or higher than the performance quoted. For most recent month-end performance, visit AmplifyETFs.com/IDVO. Brokerage commissions will reduce returns. NAV is the sum of all its assets less any liabilities, divided by the number of shares outstanding. The closing price is the last price at which the fund traded.
SECTORS
| Sector | % Weight |
|---|---|
| Financials | 23.69% |
| Information Technology | 18.73% |
| Materials | 13.64% |
| Energy | 12.10% |
| Consumer Staples | 9.56% |
| Health Care | 7.42% |
| Industrials | 7.10% |
| Communication Services | 3.81% |
| Consumer Discretionary | 2.01% |
| Utilities | 1.94% |
TOP 10 COUNTRIES
| Country | % Weight |
|---|---|
| Canada | 14.39% |
| United Kingdom | 10.76% |
| Taiwan | 9.30% |
| Japan | 8.03% |
| Germany | 6.32% |
| Brazil | 5.79% |
| Mexico | 5.68% |
| Spain | 4.81% |
| Israel | 3.70% |
| Korea | 3.70% |
TOP 10 HOLDINGS
| Ticker | Name | % Weight |
|---|---|---|
| TSM | Taiwan Semiconductor Manufacturing | 5.82% |
| MUFG | Mitsubishi UFJ Financial Group Inc | 3.62% |
| BMO | Bank of Montreal | 3.61% |
| TEVA | Teva Pharmaceutical Industries Ltd | 3.52% |
| SMFG | Sumitomo Mitsui Financial Group Inc | 3.28% |
| SIEGY | Siemens AG | 3.05% |
| ASML | ASML Holding NV | 3.04% |
| ASX | ASE Technology Holding Co Ltd | 3.02% |
| SCCO | Southern Copper Corp | 2.96% |
| SSL | Sasol Ltd | 2.66% |
HOLDINGS RETURNS
| Top Contributors | Total Return | Top Detractors | Total Return |
|---|---|---|---|
| Sasol Ltd. (SSL) | +24.60% | SK Hynix Inc (SKHY) | -18.97% |
| British American Tobacco Plc (BTI) | +14.88% | Banco Santander SA (SAN) | -18.06% |
| Imperial Oil Ltd. (IMO) | +12.45% | Taiwan Semiconductor (TSM) | -10.97% |
SECTOR RETURNS
All data as of 10/31/2026. Subject to change at any time. Fund holdings should not be considered recommendations to buy or sell any security. View Current Complete Holdings.