

COMMENTARY
If you slept through the month of April and looked at levels in the equity markets when you awoke at the end of the month, you might have thought you didn’t miss much at all. The S&P 500 was essentially flat for the month while the Nasdaq 100 managed a small gain. In the middle was a wild ride that kicked off with the tariff announcements on April 2nd. What followed was one of the swiftest, albeit orderly, market selloffs we’ve seen in a long time. The CBOE Volatility Index (VIX) crossed 60, indicating a high aversion to risk, but the traditional safe-haven of US Treasuries actually saw rates increase by mid-month to nearly 4.5% on the 10-year. The flight-to-safety was most pronounced in gold, but as the White House began to provide additional clarity around tariffs, negotiations, and exemptions for key-industries, investors waded back into equities that staged a 7-day (and counting) rally into month-end and appear to be optimistic that the worst is behind us.
During April, DIVO returned -1.46% while the benchmark, the S&P 500 Index, returned -0.68% and the CBOE S&P 500 BuyWrite Index (BXM) returned –1.63%. Year-to-date, DIVO has returned 0.49% while the S&P 500 has returned -4.92%. The Fund performed well relative to the S&P 500 over the volatile month, outperforming until a late-month equity rally which was led by the Information Technology sector. That sector continues to be underweight in DIVO, relative to the S&P 500, as many of those companies don’t pay dividends and therefore aren’t eligible to be included in the Fund, while Financials continue to be an overweight sector. Strong security selection within Financials helped drive performance for the Fund.
The biggest positive contributions to returns from a sector perspective in April was Financials (+0.74%), Consumer Discretionary (+1.95%) and Information Technology (+0.37%).1 Health Care (-13.82%) contributed the least to the return followed by Energy (-18.67%). Positions that contributed most significantly included Microsoft (MSFT), TJX Companies (TJX) and CME Group (CME) while UnitedHealth (UNH) and Chevron (CVX) were among the biggest detractors. Since December, shares of UnitedHealth have continued to be volatile, and as highlighted in earlier commentaries, the position in the Fund has been reduced as a cautionary measure.
The pullback in equities was an opportunity to deploy some of the cash in the Fund. During April no new companies were introduced to the portfolio, but existing holdings were added to during several periods of weakness. Apple (AAPL), American Express (AXP), Caterpillar (CAT), McDonalds (MCD) and Meta (META) were added to. Salesforce (CRM) was reduced early in the month as the evidence pointed to the tech sector leading to the downside.
From an option standpoint, the increase in volatility created an opportunity to be more active in call writing. New calls were sold during the month on Agnico Eagle Mines (AEM), Apple (AAPL), Goldman Sachs (GS), IBM (IBM), Microsoft (MSFT) and Verizon (VZ). Many of the existing options from last month were rolled forward while calls on Home Depot (HD) and Procter & Gamble (PG) expired.
At the end of the month, the portfolio held a total of seven covered calls2 approximately 19.60% of the portfolio was covered.
The performance data quoted represents past performance and does not guarantee future results. Investment return and principal value of an investment will fluctuate so that an investor’s shares, when sold or redeemed, may be worth more or less than the original cost. Current performance may be lower or higher than the performance quoted. For most recent month-end performance, visit DIVOETF.com.
YIELD
| Distribution Frequency: Monthly |
Distribution Rate: 4.76% |
30-Day SEC Yield: 1.79% |
Distribution Rate is the normalized current distribution (annualized) over NAV per share. Distributions have been classified as a return of capital and may be comprised of option premiums, dividends, capital gains, and interest payments. As of the most recent distribution, 70% was estimated to be return of capital. See Form 19(a)-1. There is no guarantee the ETF will pay a distribution. 30-Day SEC Yield is a standard yield calculation developed by the Securities and Exchange Commission that allows for fairer comparisons among bond funds. It is based on the most recent month end. This figure reflects the income earned from dividends – excluding option income – during the period after deducting the Fund’s expenses for the period.
PERFORMANCE
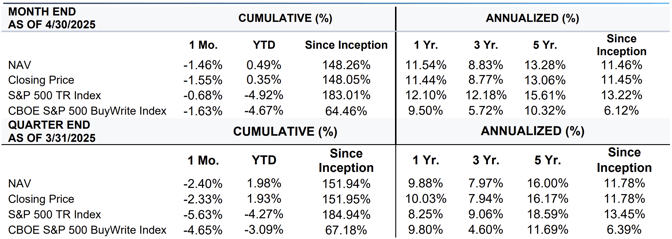
Fund inception date: 12/14/2016. DIVO’s gross expense ratio is 0.56%. The performance data quoted represents past performance. Past performance does not guarantee future results. The investment return and principal value of an investment will fluctuate so that an investor's shares, when sold or redeemed, may be worth more or less than their original cost and current performance may be lower or higher than the performance quoted. Short-term performance, in particular, is not a good indication of the fund’s future performance, and an investment should not be made based solely on returns. For performance data current to the most recent month-end please visit AmplifyETFs.com/DIVO. Brokerage commissions will reduce returns. NAV is the sum of all its assets less any liabilities, divided by the number of shares outstanding. The closing price is the last price at which the fund traded.
SECTORS
| Sector | % Weight |
TOP 10 HOLDINGS
| Ticker | Name | % Weight |
All data as of 4/30/2025. Subject to change at any time. Fund holdings should not be considered recommendations to buy or sell any security. View Current Complete Holdings.