



Bitcoin: a technical take, divergence from Tech, and year-end tax considerations.
Katie Stockton, CMT, Portfolio Manager
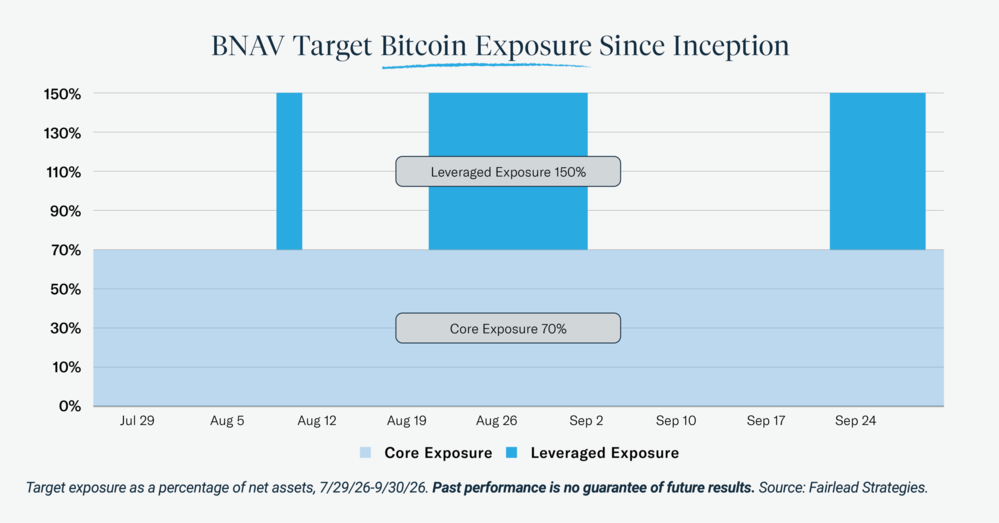
The Amplify Fairlead Tactical Bitcoin ETF (BNAV) is a systematic, model-driven exchange-traded fund that uses a disciplined, repeatable process to manage bitcoin exposure. The model is based on technical analysis, focusing on indicators that measure short-, intermediate-, and long-term momentum. BNAV maintains a core bitcoin exposure of approximately 70% of net assets and increases exposure to approximately 150% when momentum aligns across timeframes. BNAV seeks long-term capital appreciation by actively managing exposure to bitcoin.
The third quarter of 2026 was a constructive start for BNAV, which launched on July 29, as bitcoin was recovering from its June low near $58,600. Bitcoin advanced sharply over the quarter, led by a breakout in mid-August and further gains in September, trading up to its highest level since January. Since inception, BNAV delivered a total return of 28.76% through September 30, compared with bitcoin’s 30.78% gain over the same period at closing price (View Standard Performance). Notably, during bitcoin’s largest drawdown of the period, BNAV outperformed bitcoin by 2.39%, demonstrating the potential benefit of its trend-following approach.
The strategy’s tactical positioning was active throughout the quarter. BNAV moved to its 150% allocation three times, reflecting improved long-term momentum and positive short- and intermediate-term momentum. The most impactful levered period was initiated on August 20, when bitcoin broke out and saw follow-through into early September. At the start of the fourth quarter, BNAV was positioned at its 70% core allocation while the model awaited short-term confirmation of the bullish long-term turnaround.
BITCOIN: A TECHNICAL TAKE
Fairlead’s technical outlook for bitcoin is constructive, with intermediate-term momentum still positive. A breakout was made decisive above key resistance near $82,800–$83,900, as shown by the dotted purple line, defined by the May high and the 38.2% Fibonacci1 retracement of the decline from the October 2025 high to the June 2026 low. Initial support1 can currently be gauged by the rising 50-day moving average (not shown).
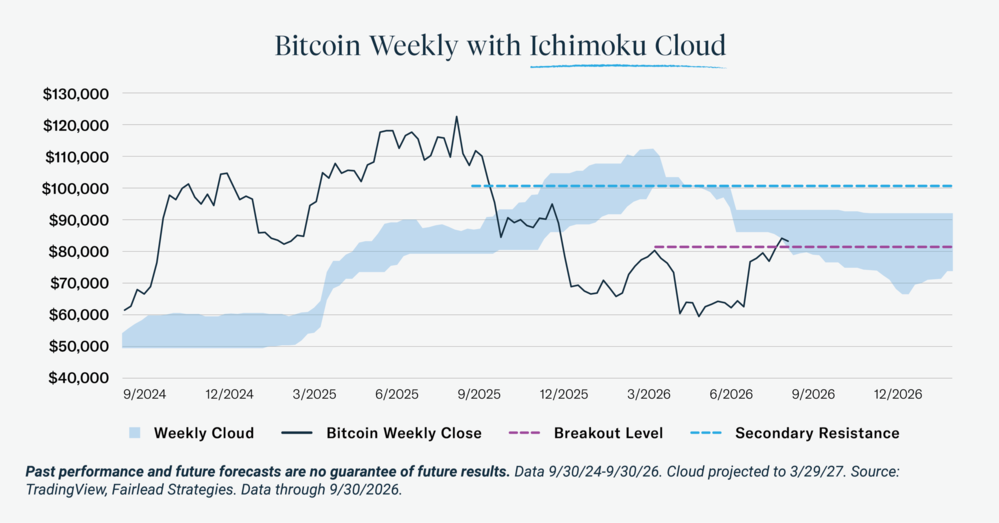
From a long-term perspective, bitcoin has an oversold upturn that was last seen in early 2023, suggesting its cyclical downtrend has matured. The upper boundary of the weekly Ichimoku Cloud1, represented by the shaded blue band, marks resistance1 near $93,100. A move above the cloud would put bitcoin above this indicator for the first time since late 2025. Beyond the cloud, the dotted blue line marks secondary resistance1 near $100,000, corresponding with the 61.8% Fibonacci retracement of the same decline.
Key Levels, In Summary:
- $82,800-$83,900: Key breakout level defined by the May 2026 high and the 38.2% Fibonacci retracement level.
- $81,200: Support defined by the rising 50-day moving average as a trailing gauge.
- $93,100: Resistance represented by the upper boundary of the weekly Ichimoku Cloud.
- $100,000: Secondary resistance at the 61.8% Fibonacci retracement of the decline from the October 2025 high to the June 2026 low.
BITCOIN DIVERGES FROM TECHNOLOGY
For much of the past two years, bitcoin traded like a high-beta1 extension of the technology sector, with its correlation1 to the Nasdaq-100 Index holding between 0.40 and 0.60 for most of that period. That relationship has been breaking down. Bitcoin’s 90-day correlation with the Nasdaq-100, based on daily returns, has fallen from 0.58 in early January to 0.31 in late August, ending the quarter at 0.36.
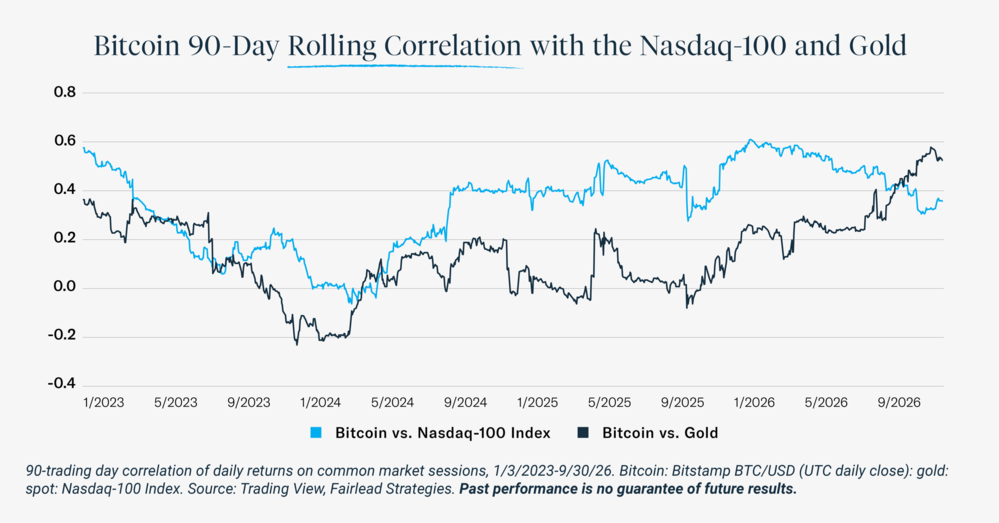
At the same time, bitcoin’s correlation with gold has climbed, lifting from 0.23 in early January to 0.59 in mid-September, and has been above bitcoin’s correlation with the Nasdaq-100 since July. This matters for portfolios. When bitcoin moves in step with technology stocks, the risk is amplified for tech-heavy portfolios. When bitcoin moves more closely with gold, and apart from the Nasdaq-100, it can act as a diversifier rather than a growth amplifier. Correlations can change, and bitcoin is far more volatile than gold, but this change in character matters for investors who have held back from bitcoin because of its correlation to the technology sector.
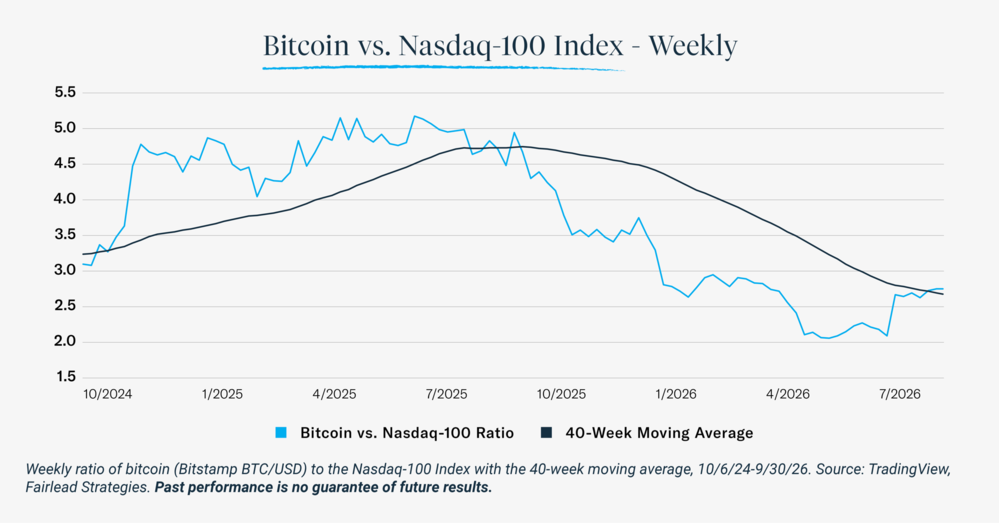
Bitcoin is not just diverging from the Nasdaq-100, it has outperformed. The bitcoin-to-Nasdaq-100 ratio has risen 42% from its June 30 low and has moved above its 40-week moving average for the first time since October 2025, a sign that the relative strength shift may be lasting. Bitcoin has also outperformed gold, with the bitcoin-to-gold ratio holding above its own 40-week moving average.
Investors are taking notice of bitcoin’s outperformance. After heavy outflows in May and June, including the largest monthly outflow on record for U.S. spot bitcoin ETPs in June, net inflows returned in July, followed by strong inflows in August and September. The return of investor demand after bitcoin’s June low supports the improving trend.
We view bitcoin’s reduced correlation to the Nasdaq-100 as one of the year’s more important developments. The next test will come during an equity market pullback: if bitcoin continues to hold up while technology stocks weaken, its case as a portfolio diversifier grows considerably stronger.
YEAR-END TAX CONSIDERATIONS
With bitcoin still well below its October 2025 peak near $126,000, many investors who purchased bitcoin or spot bitcoin ETPs over the past year may hold unrealized losses. As year-end approaches, investors may want to consider harvesting losses for tax reasons without giving up bitcoin exposure.
Because BNAV’s tactical approach and options-based structure differ meaningfully from spot bitcoin ETPs, the fund may serve as an attractive alternative for investors seeking to realize losses in bitcoin while taking a more active approach to investing in bitcoin. BNAV’s exposure ranges from approximately 70% to 150% of net assets, so position sizing should reflect that difference.
To learn more about how BNAV manages bitcoin exposure, visit BNAV’s fund page at amplifyetfs.com/bnav.
For additional information regarding historical analysis and methodology, please contact info@fairleadstrategies.com.
FUND INFORMATION
| Ticker | BNAV |
|---|---|
| Launch Date | July 29, 2026 |
| Total Expense Ratio | 0.74% |
| Net Assets | $3,859,740 |
| NAV | $32.16 |
| Primary Exchange | Cboe BZX |
| Adviser | Amplify Investments LLC |
| Sub-Adviser | Fairlead Asset Management LLC |
Data as of 9/30/26.
PERFORMANCE
| QUARTER END AS OF 9/30/2026 |
Cumulative (%) | Annualized (%) | |||||
|---|---|---|---|---|---|---|---|
| 1 Mo. | YTD | Since Inception |
1 Yr. | 3 Yr. | 5 Yr. | Since Inception |
|
| NAV | 5.22% | - | 28.66% | - | - | - | - |
| Closing Price | 5.21% | - | 28.76% | - | - | - | - |
Since inception returns are cumulative and not annualized. The performance data quoted represents past performance and does not guarantee future results. Investment return and principal value of an investment will fluctuate so that an investor’s shares, when sold or redeemed, may be worth more or less than the original cost. Current performance may be lower or higher than the performance quoted. For most recent performance, visit AmplifyETFs.com/BNAV. Brokerage commissions will reduce returns. NAV is the sum of all its assets less any liabilities, divided by the number of shares outstanding. The closing price is the last price at which the fund traded.
Visit the BNAV website for more information and regulatory documents.