Key Insights to Navigate the Fed's New Easing Cycle
After months of anticipation, the Federal Reserve has cut its benchmark interest rate by 50 basis points (0.50%). The move follows months of speculation and is likely to be followed by additional rate cuts in the coming months. Now that the guessing game of “Will the Fed Cut and by How Much” has ended — at least for now — investors are left wondering what it means for their portfolios and how to navigate the new environment. With that in mind, here are three insights to help investors in the months ahead:
Understand the economic context. To understand the implications of the Fed cut, it’s important to first note why they made the move. The Fed has been attempting a highwire balancing act of maintaining economic growth and achieving a soft landing, while reining in inflation. Indeed, the rate of inflation has been slowing in recent months. However, too much stimulus resulting from a rate cut could reignite it.
In the end, concerns about slower economic growth won out. Unemployment is starting to tick up, and there are other signs that the economy is slowing. The fact that the Fed cut by 50 basis points, rather than 25, highlights that they consider a stalling economy to be the bigger risk versus inflation picking back up. It is important to remember that during the 2006-07 rate cut cycle then Fed Chairman Ben Bernanke (in hindsight) was criticized for doing too little, too late, which is probably something current Chairman Jerome Powell wants to avoid. If you win the war on inflation but it costs the US a recession, did you really win?
As always, keep an eye on economic data to see if the Fed got the timing (and size of the cut) right this time. The Fed has commonly cited two main drivers in interest rate decisions and economic outlook: the employment rate and inflation. It will be important to follow both closely in the months ahead to see whether the Fed will follow with additional — and larger — cuts.
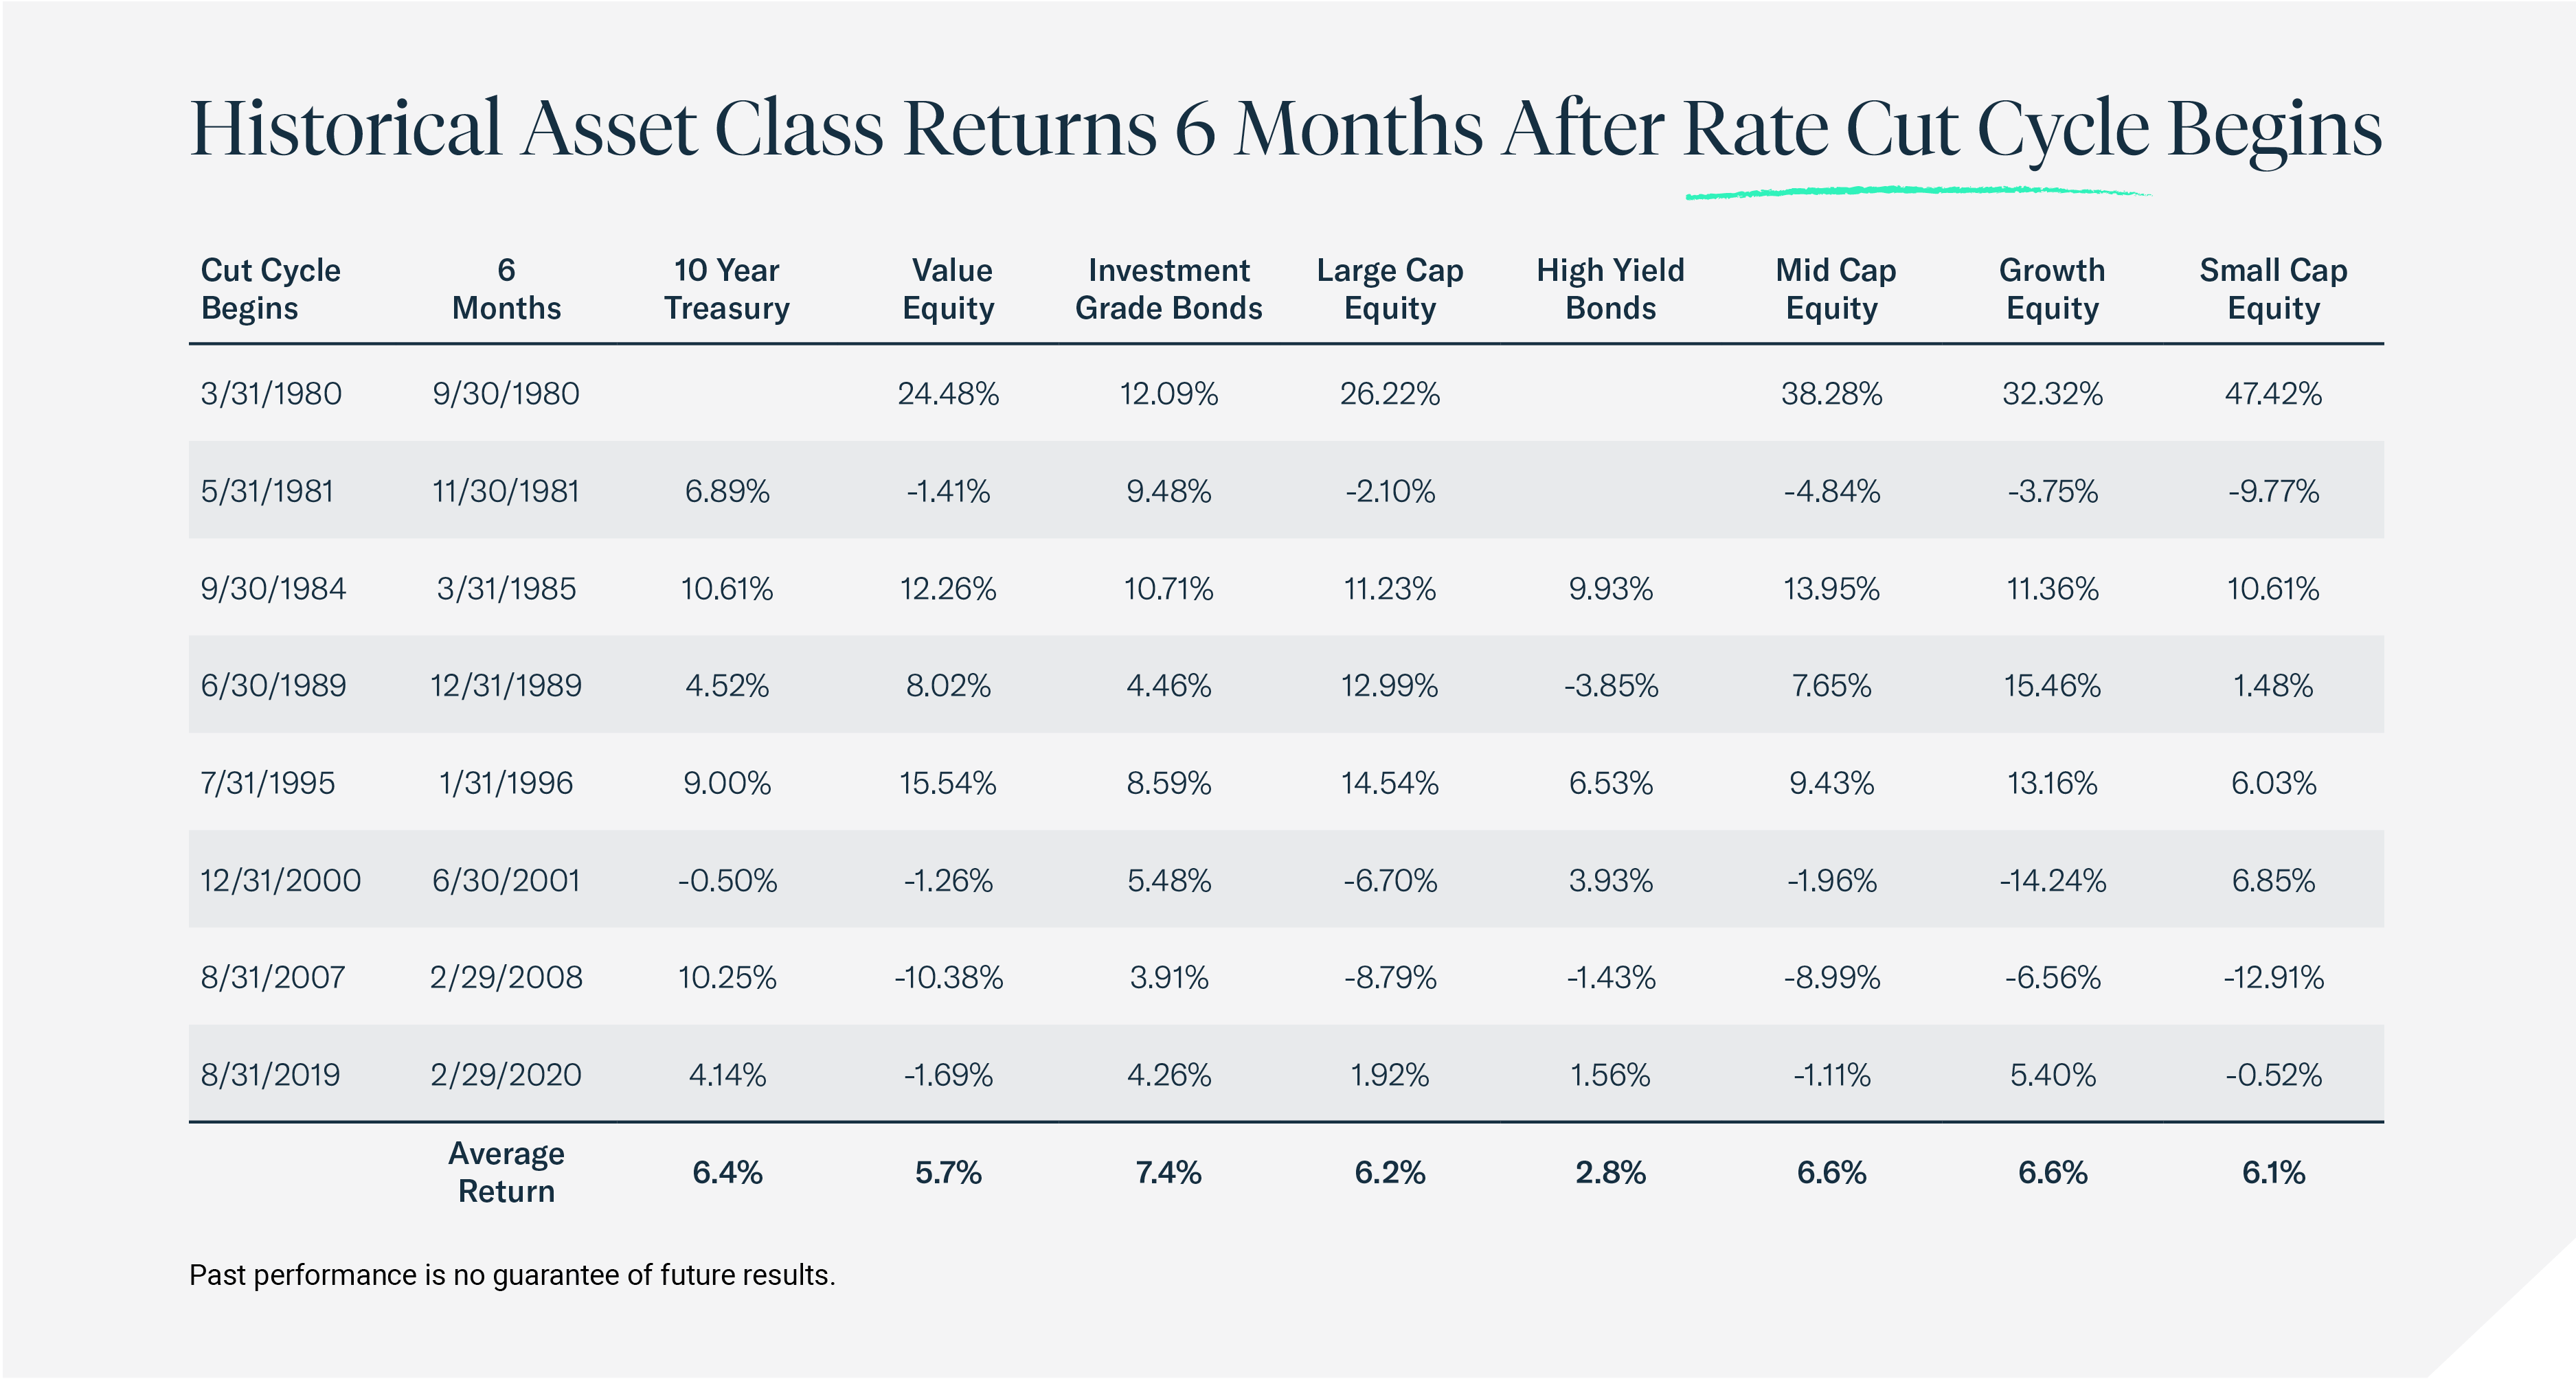
History can be a guide — sort of. Investors understand that past performance does not predict the future, but history can still reveal a great deal. The Federal Reserve has now launched nine easing cycles by lowering interest rates since 1980, including the current one. Each of those cycles took place in unique macroeconomic environments, some with rising inflation or unemployment data, rising and falling GDP or other data. In general, high-quality bonds like US Treasuries and investment grade debt, have performed well on average, as the chart below shows.

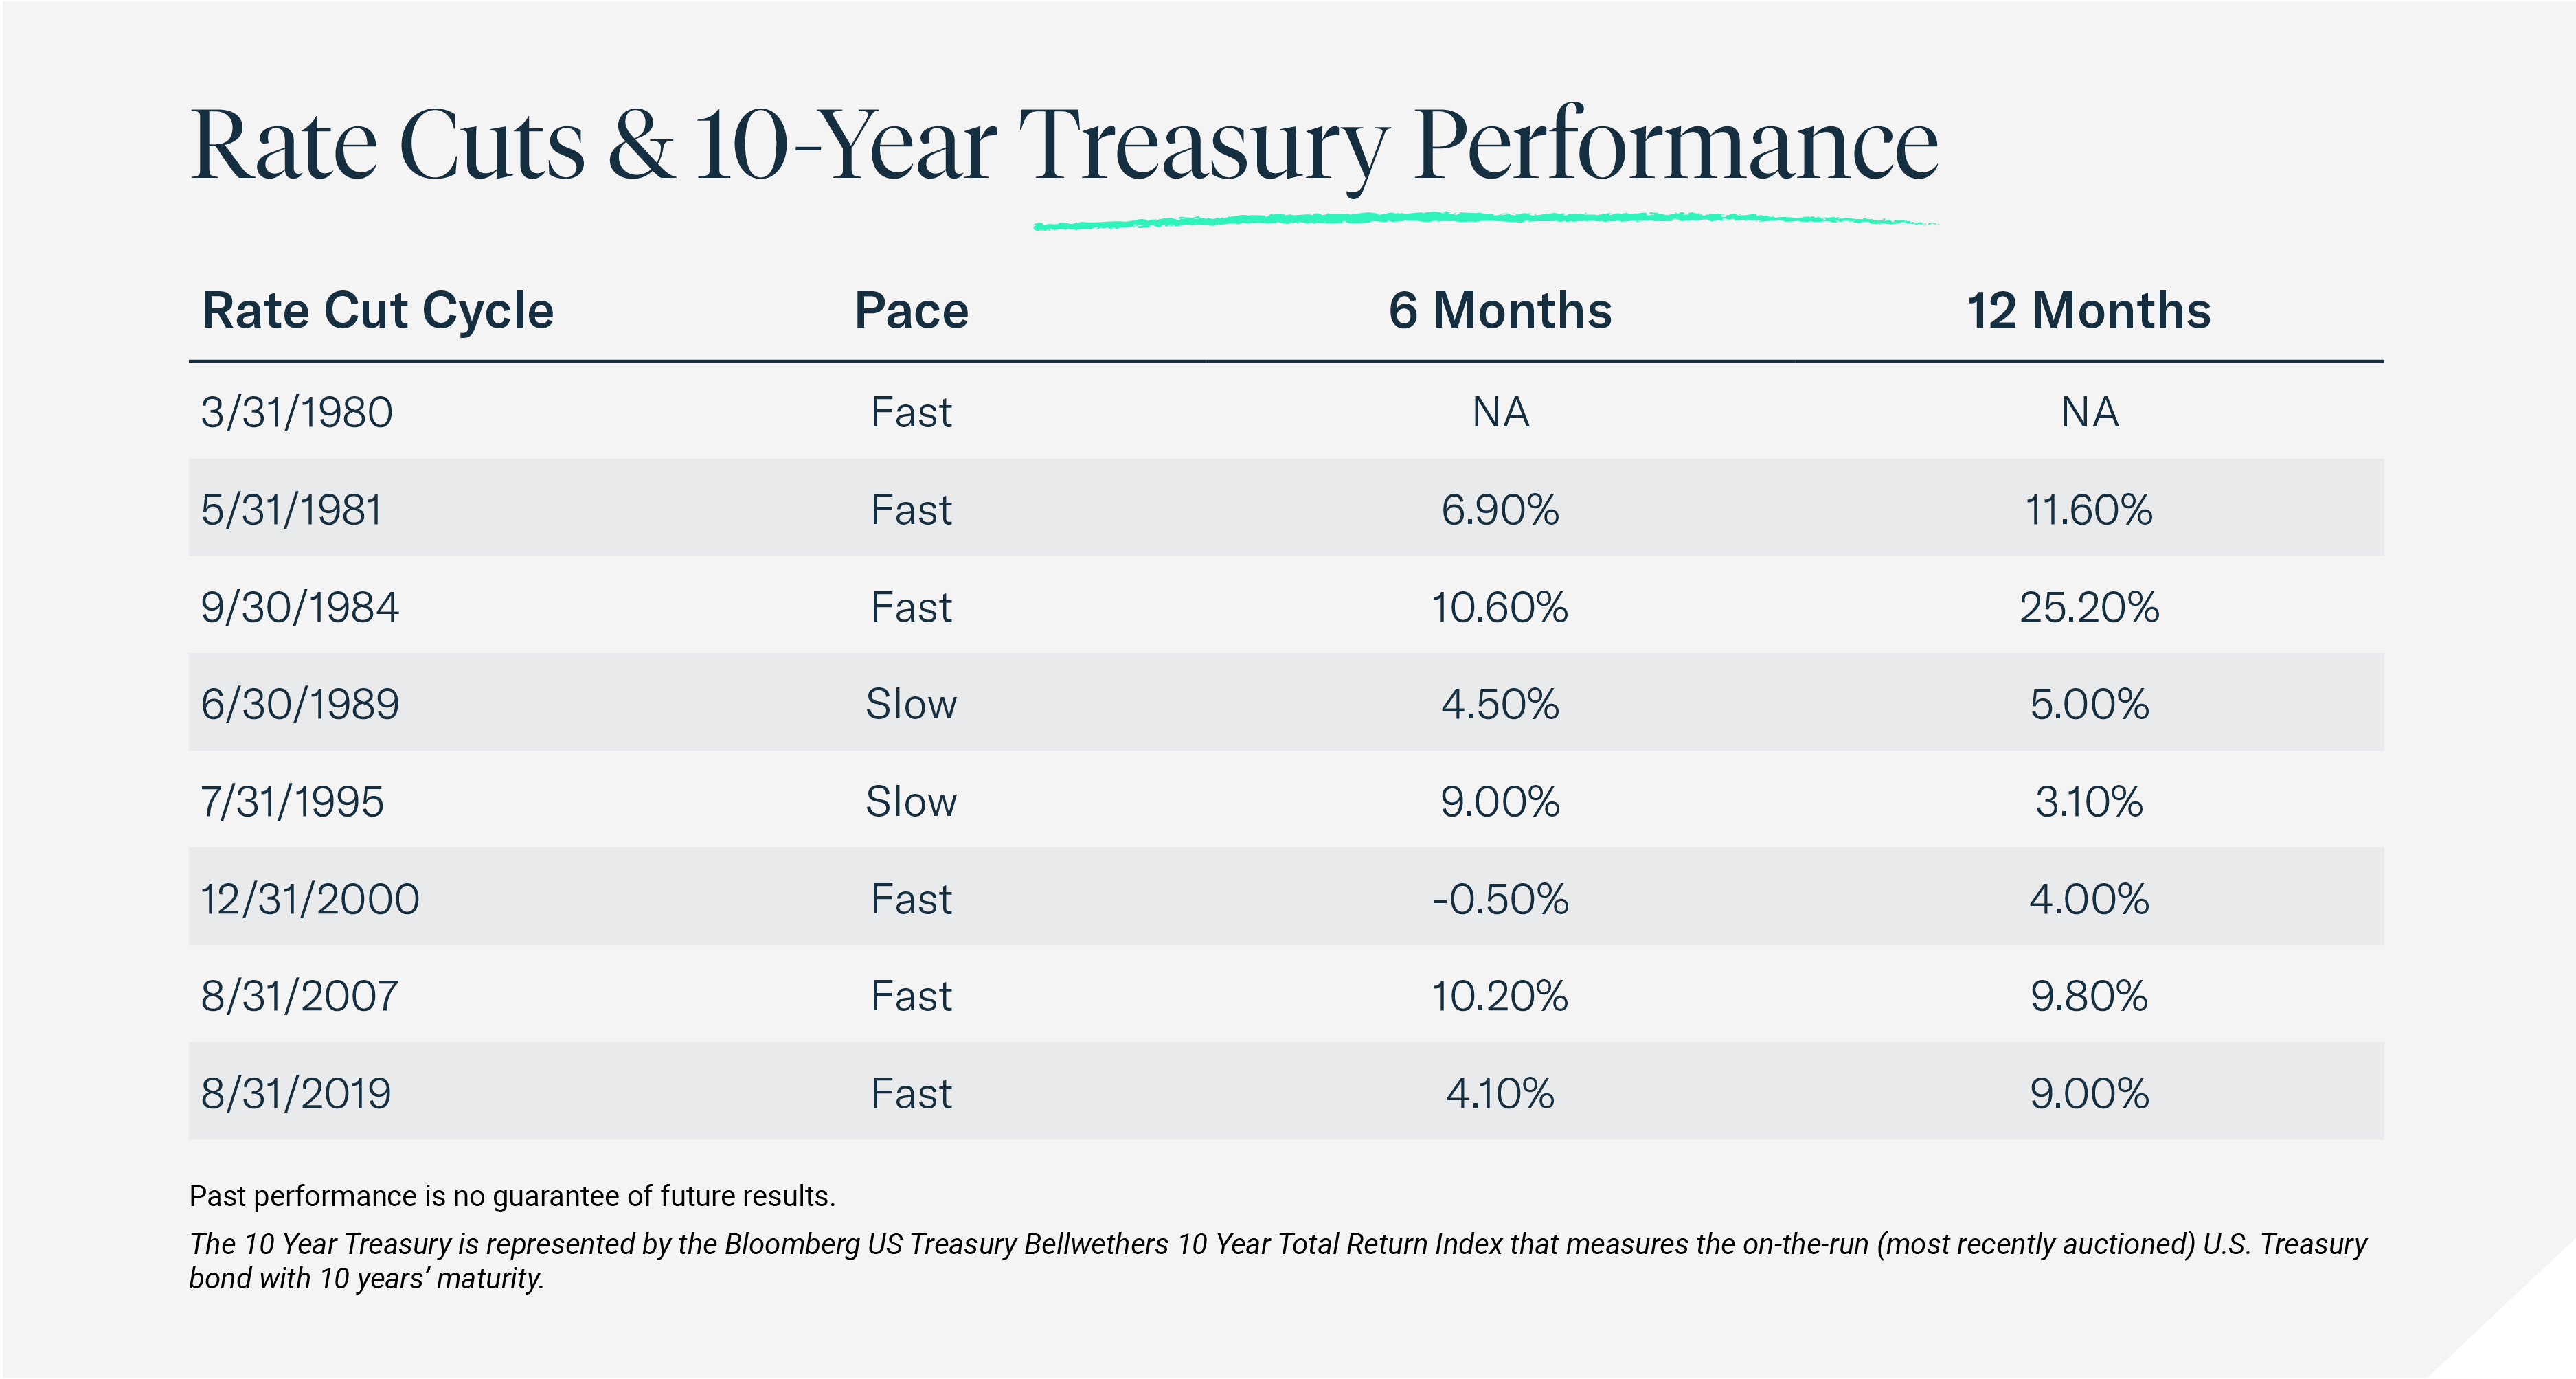
Moreover, it is also important to note that the pace of future cuts can be just as important as the size. As the chart below illustrates, the best bond performance 6 or 12 months after a cycle begins generally (but not always) comes with fast rate cut cycles.

Source: Amplify ETFs Research, 9.20.24
Fixed income is still attractive – especially if volatility spikes. Can history be repeated then and bonds outperform stocks over the next six to 12 months? Predicting market returns in the near term is fraught with peril, and we are by no means suggesting abandoning equities. In fact, we believe investors should consider well-paying dividend stocks, to help boost income streams as a buffer against volatility. But history is not the only reason to favor tilting towards higher allocations of bonds.
To begin, it is important to remember that bond yields are still high relative to recent years. Yes, they are likely to grind lower in the months ahead, but we are likely to still be far from the “low for longer” period following the 2008 Financial Crisis. In addition, as is the case with dividend stocks, finding stable income – especially when yields are decent and above the rate of inflation — is also appealing, helping to create a buffer against volatility.
Finally, bonds have long played a vital role in portfolios as potential safe havens and diversifiers from equity volatility. They may be called on to play this role again, given the historical patterns of equity volatility and the upcoming elections, as we discussed recently.
Summing Up
Recently we noted that historically the best time to adjust portfolios were the months leading up to a rate cut. Does that mean it is too late for investors to tweak their investments? The answer is no. If history is any guide, the implications of the new interest rate regime will be with us for some time. But investors may want to consider fine tuning their portfolios by adding more fixed income and dividend exposure sooner, rather than later.
Related ETFs
Treasuries
Corporate Bonds
Value Focused
Large Cap Equity is represented by the S&P 500 Total Return Index is a market-capitalization weighted index of the 500 largest U.S. publicly traded companies.
The high yield bonds are represented by the Bloomberg US Corporate High Yield Total Return Index that measures the USD-denominated, high yield, fixed-rate corporate bond market.
Investment grade bonds are represented by the Bloomberg US Agg Index that measures the investment grade, US dollar-denominated, fixed rate taxable bond market.
10-year Treasury is represented by the Bloomberg US Treasury Bellwethers 10 Year Index that measures the on-the-run (most recently auctioned) U.S. Treasury bond with 10 years’ maturity.
The growth equity is represented by the Russell 1000® Growth Total Return Index that measures the performance of the large-cap growth segment of the US equity universe.
The value equity is represented by the Russell 1000® Value Index that measures the performance of the large-cap value segment of the US equity universe.
The small cap equity is represented by the Russell 2000 Index, which measures the performance of small-cap segment of the US equity universe.
Carefully consider the Funds’ investment objectives, risk factors, charges, and expenses before investing. This and additional information can be found in Amplify Funds statutory and summary prospectus, which may be obtained by calling 855-267-3837 or by visiting AmplifyETFs.com. Read the prospectus carefully before investing.
Investing involves risk, including the possible loss of principal. Shares of any ETF are bought and sold at market price (not NAV), may trade at a discount or premium to NAV and are not individually redeemed from the Fund. Brokerage commissions will reduce returns.
Amplify ETFs are distributed by Foreside Fund Services, LLC.


