



What decades of market data can tell us about investing through election cycles
As the 2026 U.S. midterm elections approach, investors are entering a period that has historically been characterized by increased uncertainty, heightened volatility, and growing concerns about the direction of fiscal and regulatory policy. While election-related headlines often dominate investor attention, market history suggests that periods of political uncertainty can ultimately create opportunities for long-term investors.
Why Midterm Elections Matter to Markets
Markets generally dislike uncertainty. In the months leading up to midterm elections, investors often grapple with unanswered questions surrounding legislative priorities, tax policy, government spending, and the balance of power in Washington. Unsurprisingly, equity market performance during midterm election years has historically been more volatile than during other years of the presidential cycle.
Historical data highlights this tendency. Since 1950, midterm years have experienced the largest average intra-year pullback among the four years of the presidential cycle, with the S&P 500 declining an average of 17.5% from peak to trough.1
2026, by most measures has been benign with the late-January through March drawdown not quite reaching 9%.
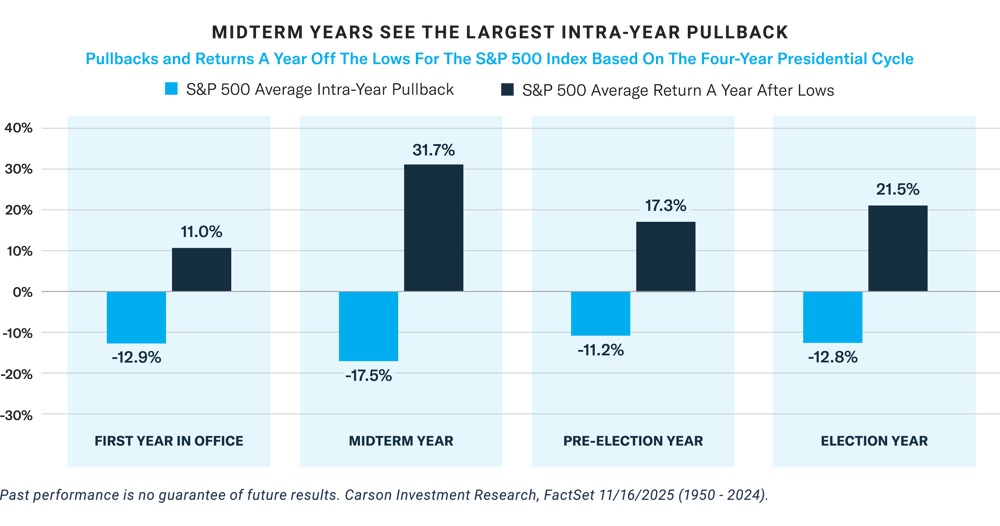
By comparison, average pullbacks in other years of the presidential cycle have ranged between approximately 11% and 13%.1
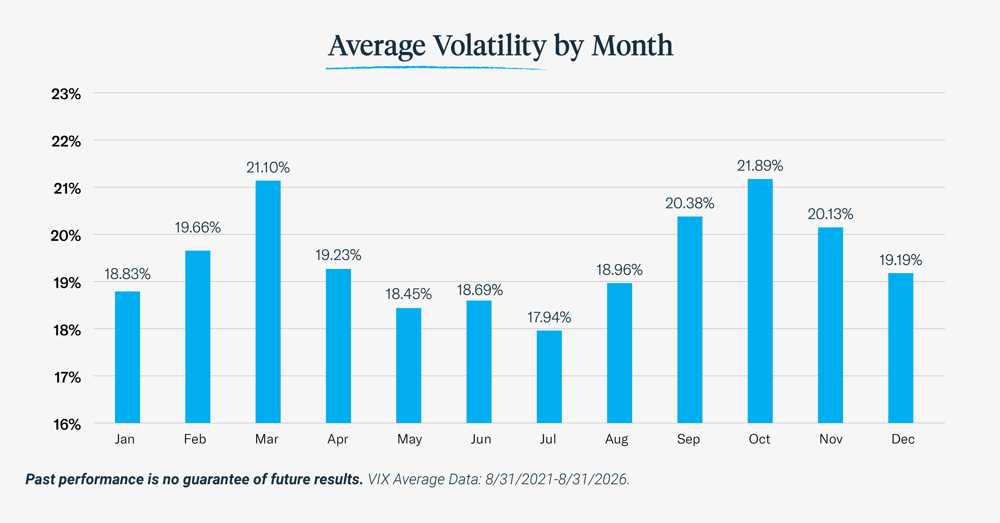
This volatility is often amplified by seasonality as demonstrated by the volatility index (VIX).
Past performance is no guarantee of future results. Amplify Data: VIX Average 8/31/2021-8/31/2026
September and October have historically been among the most volatile months of the year for equity markets, creating a period when election uncertainty and seasonal weakness can overlap.
Past performance is no guarantee of future results. Amplify data.
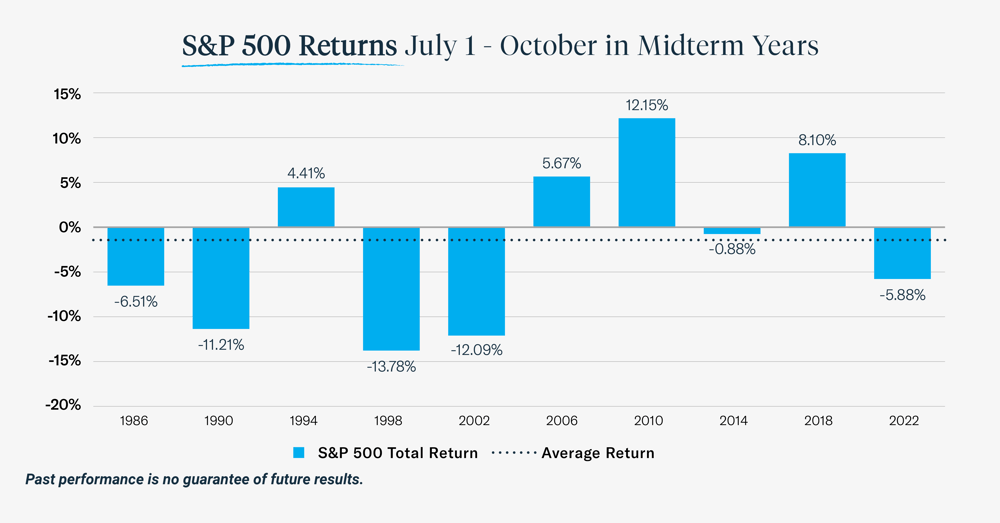
The S&P 500 has posted losses over half the time between July 1st and October 1st, which is roughly a month before Election Day over the past four decades, with an average return of approximately -2% during that period.2
A Pattern of Recovery
While the pre-election environment can be challenging, the second half of the historical pattern is often overlooked.
As election outcomes become clearer and investors gain greater visibility into the political landscape, uncertainty begins to fade. Historically, stocks have tended to recover during the final weeks leading up to Election Day and frequently continue to advance in the months that follow.
In fact, the twelve months following midterm-year market lows have historically produced some of the strongest returns in the presidential cycle. One year after midterm-year lows, the S&P 500 has generated an average return of 31.7%, outperforming the subsequent returns following lows in each of the other three years of the presidential cycle.1
One reason may be that investors place a premium on predictability. Regardless of which party gains control, elections often remove a significant source of uncertainty. Markets can then refocus on corporate earnings, economic growth, interest rates, and other business fundamentals rather than political speculation.
The Potential Impact of Washington Gridlock
Another factor closely watched by investors is the potential for divided government.
Historically, periods of congressional gridlock have often coincided with favorable equity market outcomes. While political stalemates can be frustrating from a policy standpoint, they can also reduce the likelihood of major legislative changes, creating a more predictable environment for businesses and investors.
If the 2026 elections result in a balance of power that limits significant policy shifts, investors may view that outcome as a stabilizing force. Combined with continued earnings growth and improving visibility around future policy initiatives, reduced uncertainty could provide a supportive backdrop for risk assets.
Staying Focused on the Long Term
Of course, historical patterns are not guarantees. Economic growth, inflation trends, Federal Reserve interest rate policy, geopolitical developments, and corporate earnings will likely play a far greater role in determining long-term market outcomes than election results alone.
However, history does offer an important reminder: the most challenging periods for investor sentiment have often occurred shortly before some of the strongest subsequent market advances. Midterm election years have historically featured elevated volatility and larger-than-average pullbacks, but they have also frequently laid the groundwork for powerful recoveries once uncertainty begins to recede.
The key takeaway may be simple: election years can test patience, but maintaining a disciplined, long-term perspective has historically been rewarded. As 2026 enters the heart of the midterm cycle, volatility may create headlines, but history suggests it may also create opportunities.
Investors cannot invest directly in an index. The S&P 500 Index holds 500 of the largest capitalization companies in the U.S. VIX: The CBOE Volatility Index measures the market’s expectation of 30-day volatility based on S&P 500 option prices.
Carefully consider the Fund’s investment objectives, risks, charges, and expenses before investing. This and other information can be found in the Fund’s statutory and summary prospectuses, which may be obtained at AmplifyETFs.com. Read the prospectus carefully before investing.
Investing involves risk, including the possible loss of principal. Shares of any ETF are bought and sold at market price (not NAV), may trade at a discount or premium to NAV and are not individually redeemed from the Fund. Brokerage commissions will reduce returns.
Amplify ETFs are distributed by Foreside Fund Services, LLC.
1Carson Investment Research, FactSet 11/16/2025 (1950-2024)
2Amplify Data, 9/15/26.