



Despite significant headwinds, markets rewarded long-term investors.
There is a saying that smooth seas do not make skillful sailors. The first half of 2026 put that idea to the test for investors, who navigated a war in Iran, oil prices pushing inflation to multi-year highs, and ongoing questions around artificial intelligence (AI). Despite these headwinds, markets climbed to new all-time highs, corporate earnings grew at a double-digit pace, and many asset classes delivered strong performance. The first six months of the year served as a powerful reminder of the value of staying invested and maintaining a longer time horizon.
This lesson carries added weight today, as the business cycle has now entered its seventh year and the market cycle is approaching its fifth. Concerns around inflation, the Fed, and valuations have cycled in and out of focus repeatedly over this period. Managing these challenges is not just a feature of investing; it is precisely why investors who stay the course tend to be rewarded over the long run. As the second half of the year unfolds, including developments in the Middle East conflict, the upcoming midterm election, and anticipated market activity such as initial public offerings (IPOs), maintaining perspective will be essential.
Key Market and Economic Drivers in the first half of 20261
-
The S&P 500, Nasdaq, and Dow Jones Industrial Average have returned 9.6%, 12.8%, and 8.9% year-to-date through the end of June, respectively. The second quarter was historically strong with the S&P 500 returning 14.9%, the Nasdaq 21.4%, and the Dow 12.9%.
-
The Bloomberg U.S. Aggregate Bond Index has risen 0.6% year-to-date. The 10-year Treasury yield ended the second quarter at 4.47%, rising from 4.17% at the start of the year.
-
Developed market international stocks (MSCI EAFE) have gained 7.7% and emerging market stocks (MSCI EM) have returned 22.7% year-to-date, both in U.S. dollar terms.
-
The Bloomberg Commodities Index has risen 12.3% year-to-date, driven by a strong first quarter gain of 23.3%, partially offset by a decline of 8.9% in the second quarter.
-
Brent crude peaked just under $120 per barrel in May before closing the quarter at $73 per barrel.
-
Gold prices fell to $4,007 per ounce while Bitcoin declined to a recent low of $58,633.
-
Headline CPI rose 4.2% year-over-year in May, driven largely by energy prices. Core CPI, which excludes food and energy, rose 2.9%.
- The Federal Reserve kept rates unchanged at 3.50% to 3.75% through the first half of the year. Kevin Warsh was sworn in as Fed Chair in May.
The business cycle has entered its seventh year
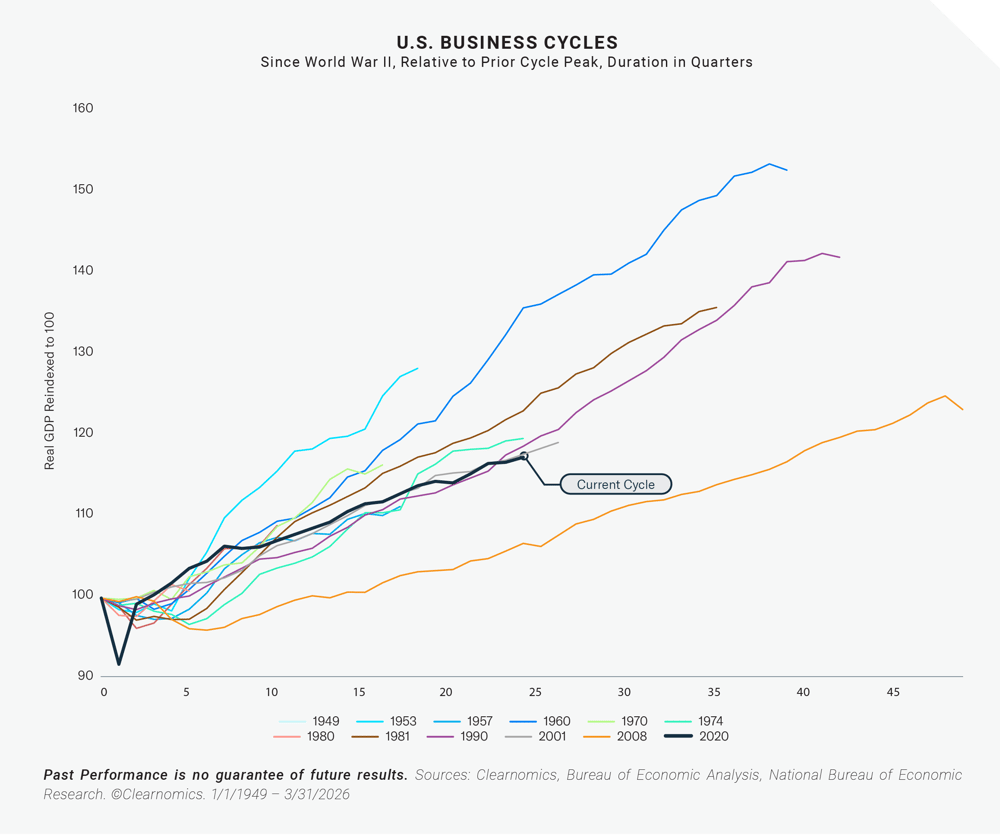
The current business cycle began in April 2020 amid the pandemic and recently passed its sixth anniversary. There were multiple moments when recession fears resurfaced, including when inflation peaked in 2022 and when tariffs disrupted trade last year. Through it all, the economy demonstrated remarkable resilience. The chart above places this cycle in historical context, noting that the longest expansions, including those following the 2008 financial crisis and the 1990s dot-com boom, lasted a decade or more.
Today, inflation remains elevated but could ease further if oil prices stay low. The job market has regained momentum, the dollar has stabilized, and business investment has accelerated. Consumers remain cautious in their outlook but continue spending on both necessities and discretionary items. On balance, the economy appears healthy, which has historically been a constructive backdrop for financial markets over the long run.
Many assets classes have contributed to portfolio returns in 2026
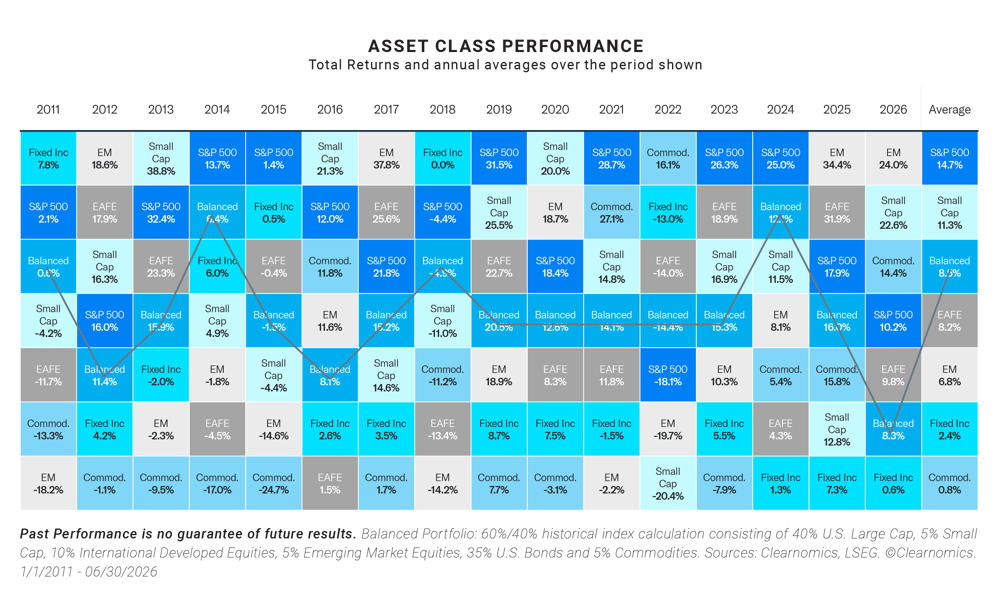
A broad range of global asset classes has performed well so far this year, continuing last year's trend. Large cap stocks, small caps, emerging markets, and commodities have all contributed positively to diversified portfolios. The second quarter, in particular, ranked among the strongest on record, partly reflecting the market recovery that began at the start of April following the outbreak of the war in Iran.
Strong corporate earnings, with profits rising over 20% in the past twelve months for S&P 500 companies,2 have underpinned these returns. At the same time, U.S. stock valuations remain historically elevated, with the S&P 500 trading at a price-to-earnings ratio of 20x, above the long-term historical average of 16x.2
While valuation ratios are not reliable short-term predictors, they serve as useful guides for building balanced, long-term portfolios and managing risk across asset classes.
Inflation remains a concern but oil prices have improved.
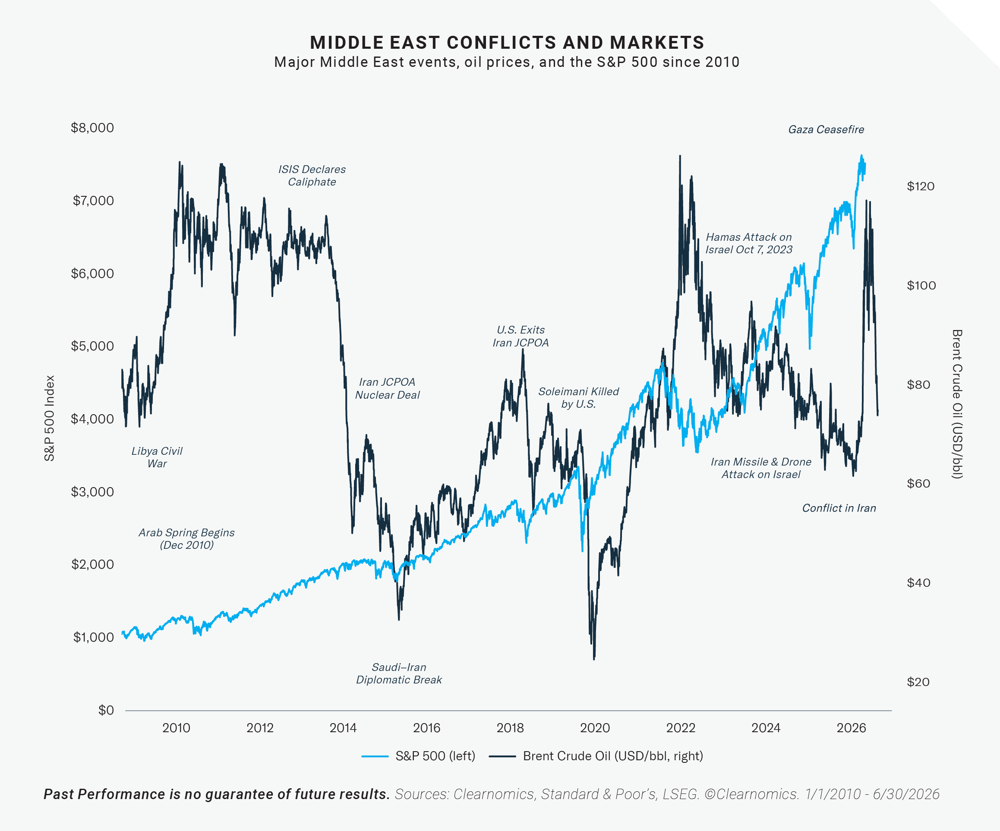
The conflict in Iran has affected the U.S. economy primarily through energy markets. Disruptions to oil transportation through the Strait of Hormuz pushed Brent crude to nearly $120 per barrel before prices pulled back significantly. More recently, oil has fallen to around $70 per barrel, near pre-conflict levels, and gasoline prices have retreated below $4.00 per gallon nationally after peaking above $4.50.3
These energy price swings drove headline CPI to 4.2% year-over-year in May, with the gasoline component jumping 40.5%.4
Notably, core CPI rose only 2.9%, indicating that inflation has remained concentrated in fuel rather than spreading more broadly. As the chart above shows, past geopolitical shocks affecting oil supply, such as Russia's invasion of Ukraine in 2022, have often been followed by stabilization and improvement in energy prices, bringing inflation back down over time.
Volatility has remained manageable despite ongoing uncertainty
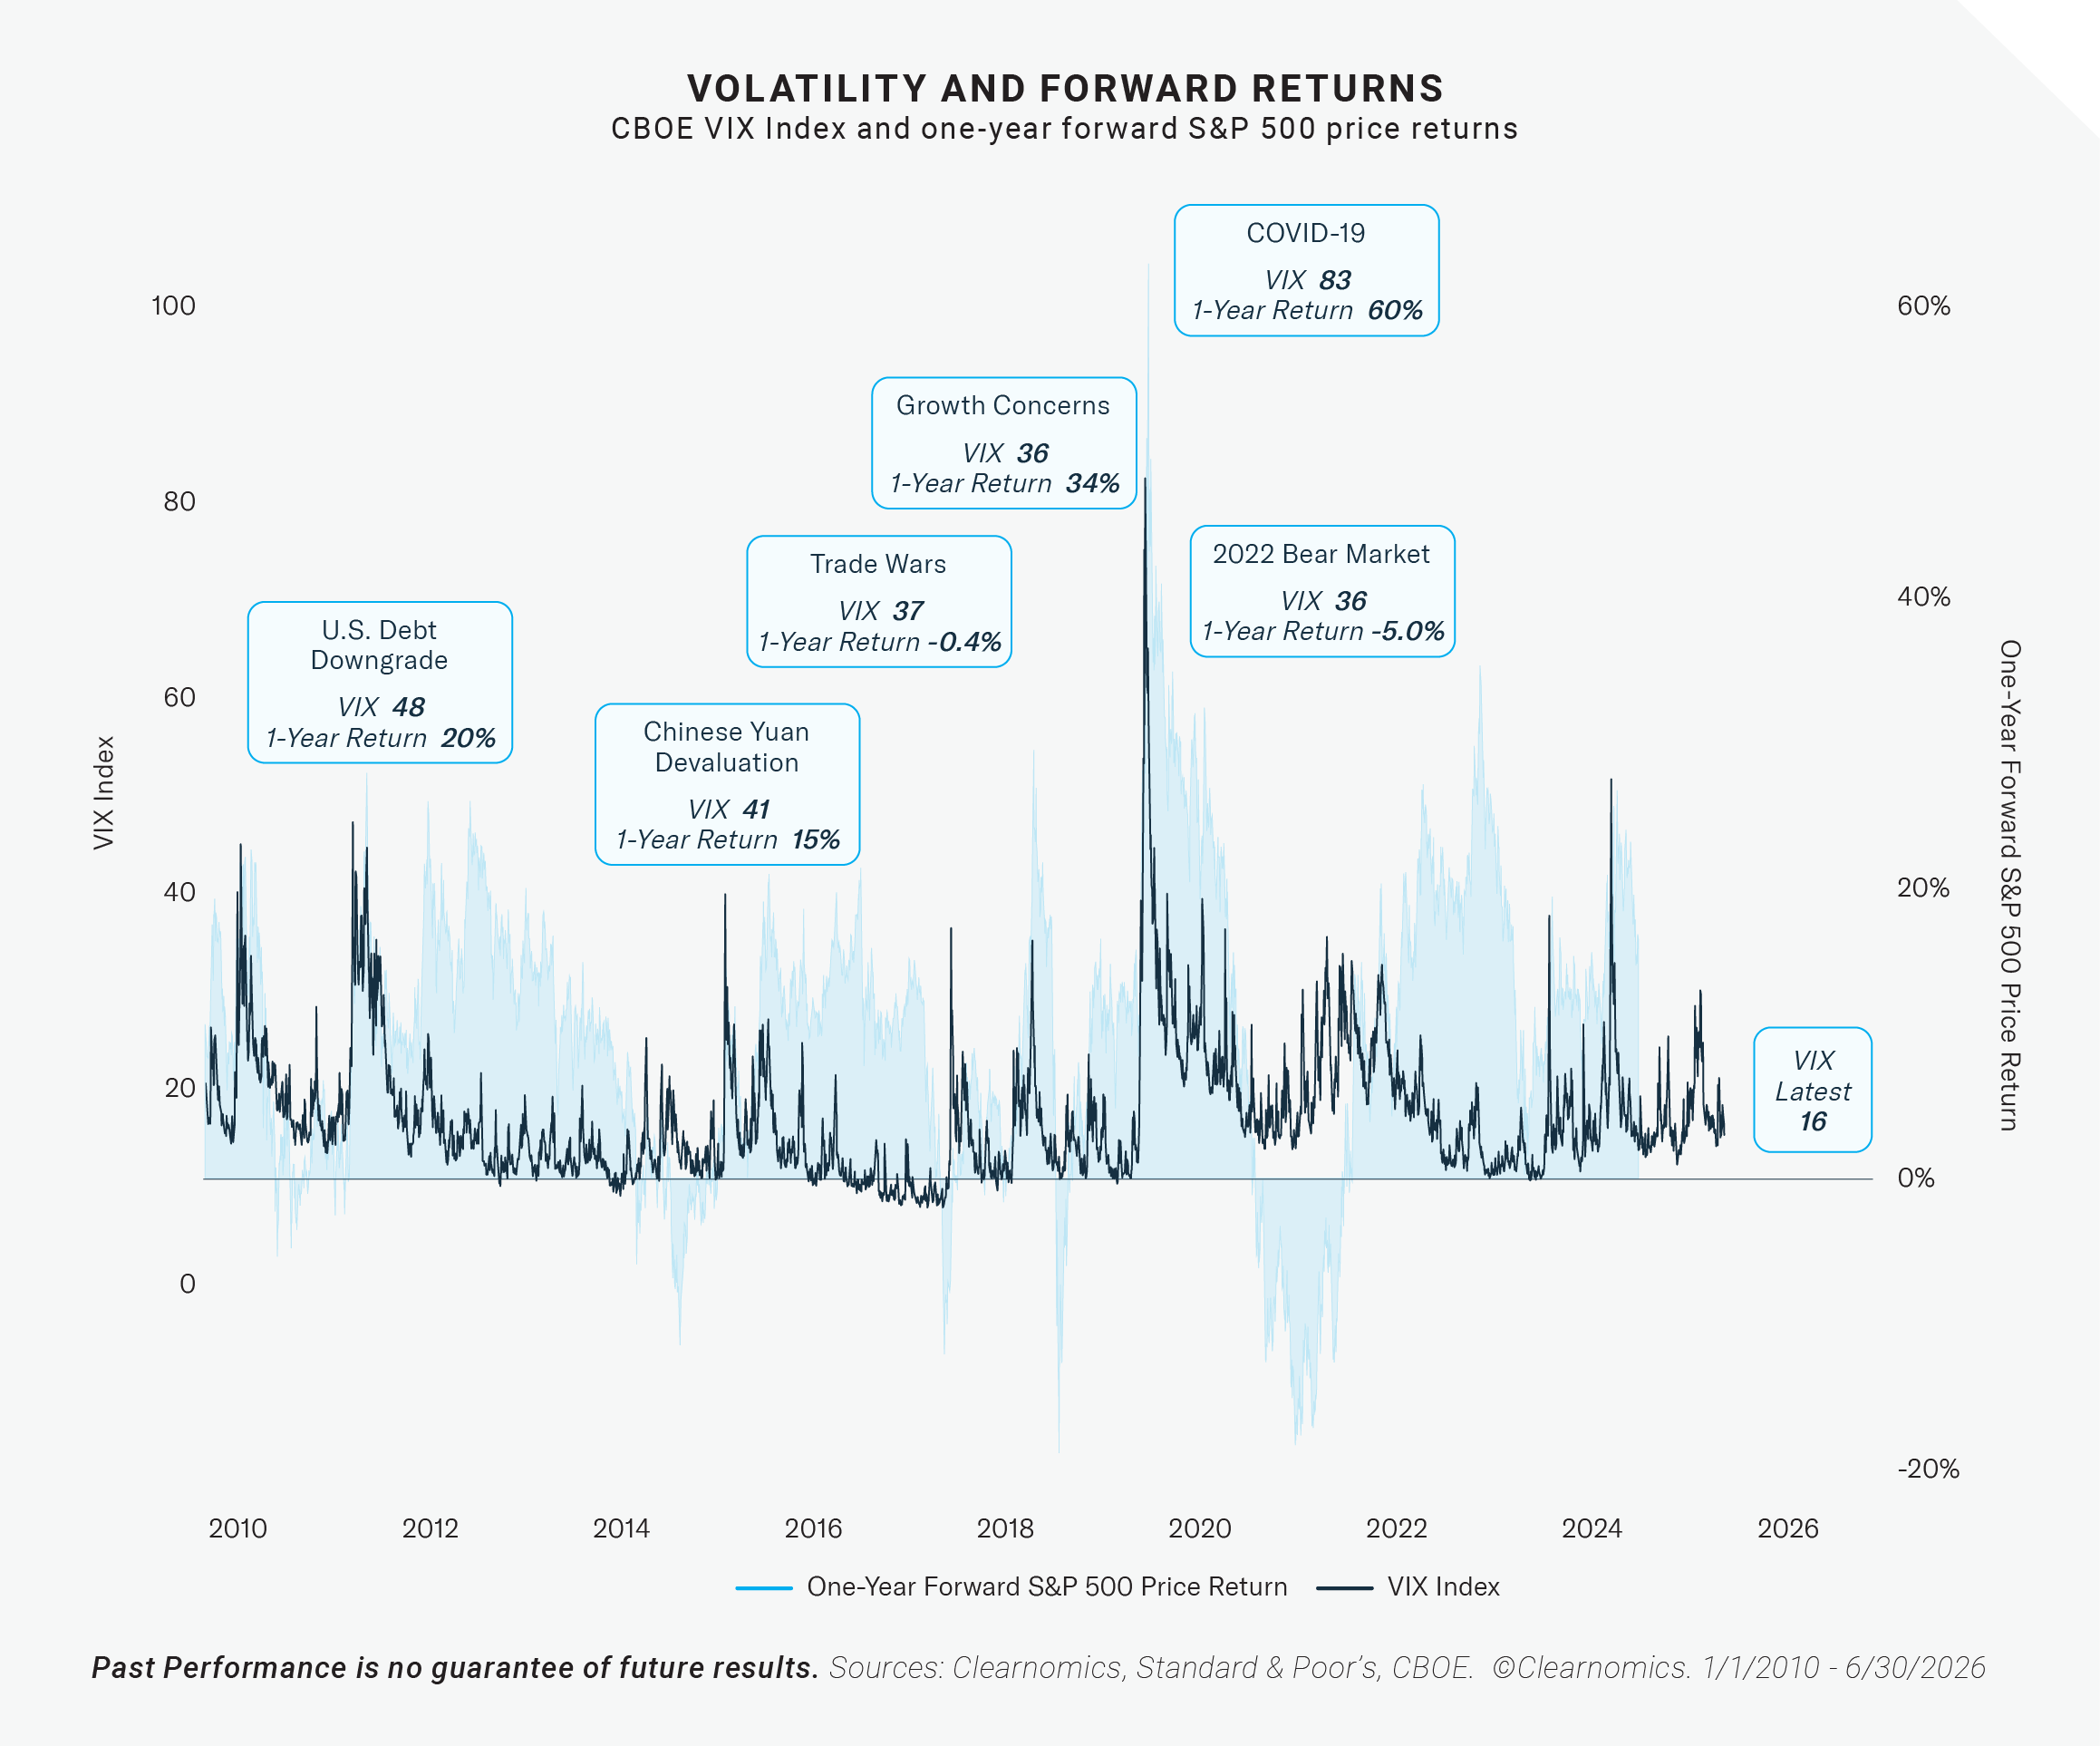
Market volatility, as measured by the Cboe Volatility Index (“VIX”), has remained contained despite a steady stream of macroeconomic events including tariffs, the Middle East conflict, and Fed uncertainty. The current VIX reading of 16 sits below its long-term average of 18.4 and well below recent peaks, as shown in the chart above. The S&P 500's largest peak-to-trough decline in 2026 has been 9%, and the index has since recovered fully, reaching 24 new all-time highs so far this year.5
The first half of 2026 reinforces an important principle: the most meaningful risk investors face during volatile episodes is not the market swings themselves, but the temptation to react to them. Holding a well-constructed portfolio designed to serve long-term financial goals, rather than attempting to time the market, remains the most effective approach as investors navigate the second half of the year.
Record cash balances highlight the cost of sitting on the sidelines
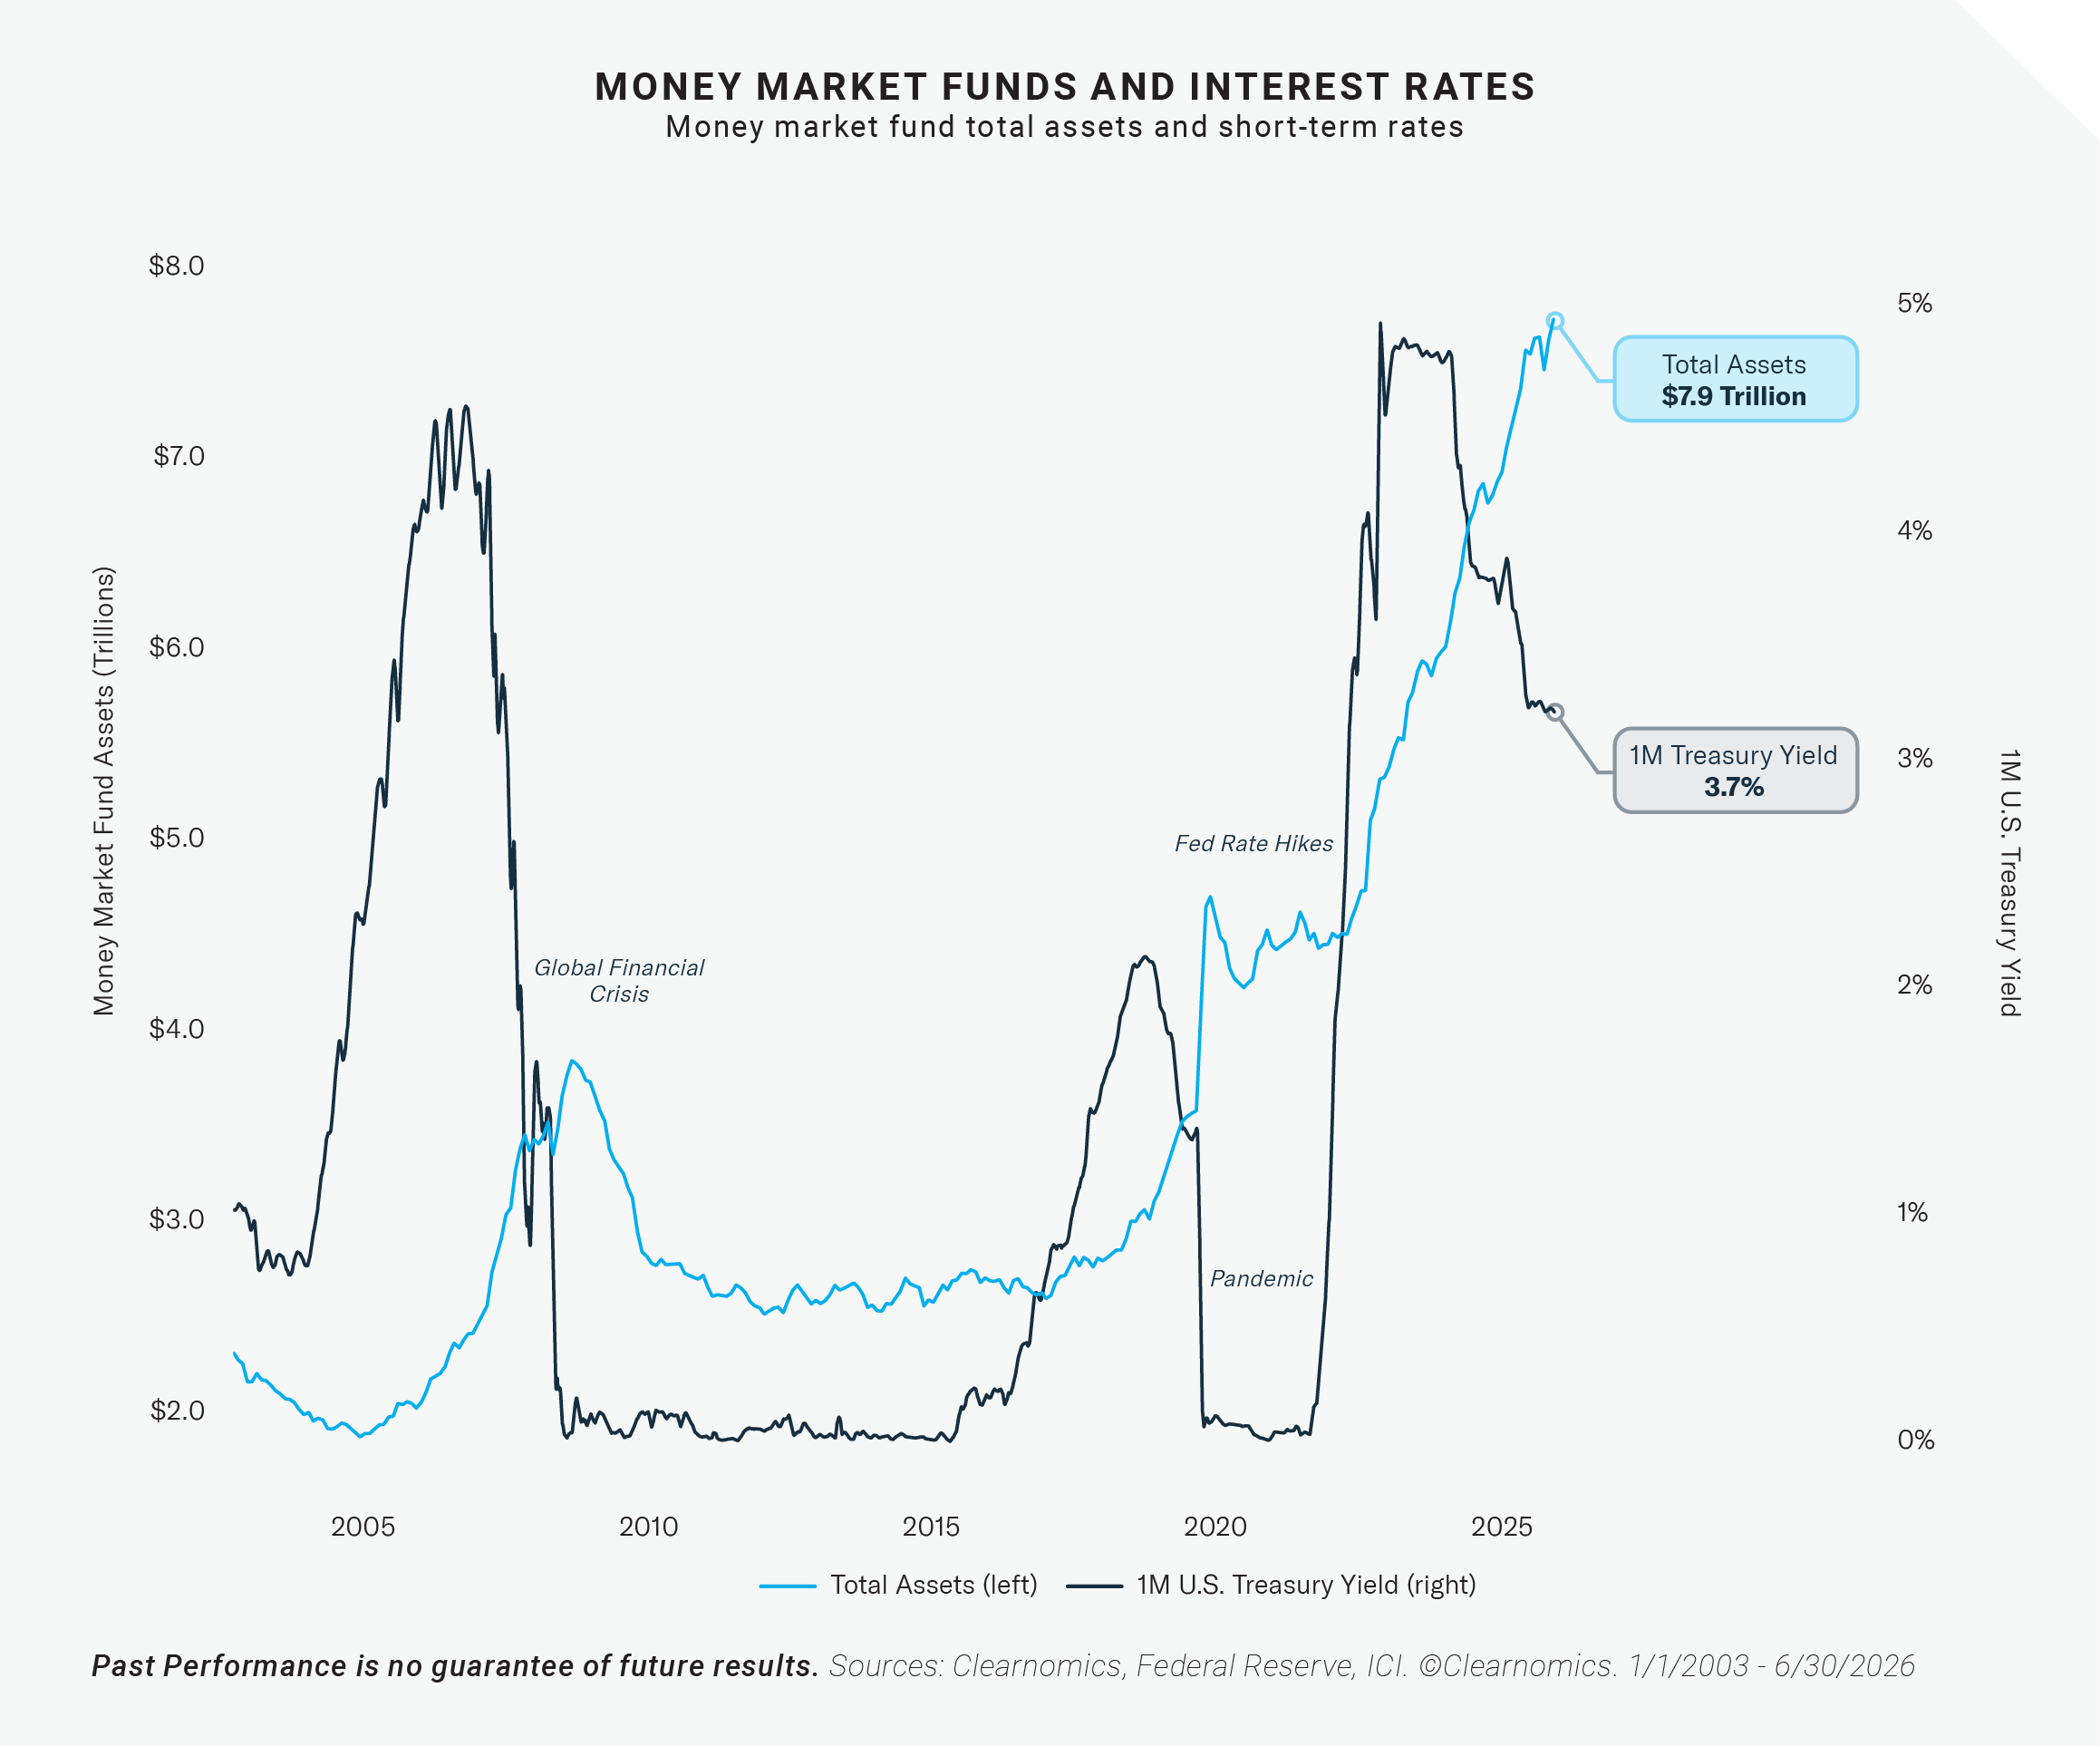
Money market fund assets have reached a record $7.9 trillion, more than double their pre-pandemic level, reflecting both market uncertainty and the period of higher short-term rates that made cash more attractive. However, cash yields often fail to offset inflation.
|
|
Over time, this dynamic erodes the purchasing power of cash holdings.
This is why maintaining a balanced portfolio capable of generating growth, income, and capital preservation remains critical. The experiences of the first half of 2026 underscore that staying invested and diversified, rather than retreating to cash, is the approach most likely to support long-term financial goals as the market and economic cycle continues.
|
The Bottom Line? The first half of 2026 has rewarded investors who stayed diversified and maintained |
1All figures are as of June 30, 2026 and are on a price return basis unless otherwise noted
2Clearnomics research and LSEG data as of June 30, 2026
3httpsa://gasprices.aaa.com/
4Chttps://www.bls.gov/news.release/cpi.nr0.htm
5Clearnomics research and Standard & Poor's data as of June 30, 2026
6Clearnomics research and FDIC data as of June 30, 2026
Indexes are unmanaged and it’s not possible to invest directly in an index. The S&P 500 Total Return Index is a market-capitalization weighted index of the 500 largest U.S. publicly traded companies. CBOE Volatility Index (VIX) is a measure of implied volatility, based on the prices of a basket of S&P 500 Index options with 30 days to expiration. Dow Jones Industrial Average is comprised of 30 stocks that are major factors in their industries and widely held by individuals and institutional investors. MSCI EAFE Index is designed to measure the equity market performance of developed markets outside the U.S. and Canada. MSCI Emerging Markets (EM) Index is designed to measure large- and mid-cap representation across emerging market countries. Bloomberg U.S. Aggregate Bond Index is designed to measure the performance of the U.S. investment grade bond market. 10-year Treasury is represented by the Bloomberg US Treasury Bellwethers 10 Year Index that measures the on-the-run (most recently auctioned) U.S. Treasury bond with 10 years’ maturity. Bloomberg Commodities Index measures the performance of the global commodities market through a basket of futures contracts across energy, metals, agriculture, and livestock. Diversification does not assure a profit, nor does it protect against loss of principal.
Carefully consider the Fund's investment objectives, risks, charges, and expenses before investing. This and other information can be found in the Fund's statutory and summary prospectuses, which may be obtained at AmplifyETFs.com. Read the prospectus carefully before investing.
Investing involves risk, including the possible loss of principal. Shares of any ETF are bought and sold at market price (not NAV), may trade at a discount or premium to NAV and are not individually redeemed from the Fund. Brokerage commissions will reduce returns.
Amplify ETFs are distributed by Foreside Fund Services, LLC.