

Markets extended their spring rally in May, pushing major U.S. indices to fresh all-time highs and reinforcing the market’s resilience despite a challenging geopolitical backdrop. Large cap growth and technology stocks continued to lead in a concentrated fashion, supported by strong earnings and sustained enthusiasm around the ongoing buildout of the AI ecosystem and related capital investment. Geopolitical uncertainty tied to the conflict in Iran remained a key headwind, contributing to a recent uptick in inflation pressures. However, a sharp decline in oil prices during May, along with a cooler-than-expected monthly personal consumption expenditure (PCE) reading, helped ease inflation concerns later in the month. While the timing of potential rate cuts has become less certain, many market participants increasingly view current interest rate levels as near neutral – supporting confidence that economic growth can continue without significant policy headwinds.
During the month of May, the Amplify CWP Growth & Income ETF (QDVO) returned 5.85% (NAV), while the benchmark, the S&P 500 Growth Index, returned 8.09%. QDVO has returned 10.66% YTD while the S&P 500 Growth Index returned 14.07%. The Fund has modestly lagged the benchmark, reflecting the current risk‑on market environment, which tends to limit upside participation for covered call strategies. Sectors that contributed the most to returns include Information Technology (+16.73%) and Consumer Discretionary (+4.40%), while Consumer Staples (-6.00%) and Communication Services (-1.56%) detracted from returns.1 Positions that contributed most significantly were Micron Technology (MU), Apple Inc (AAPL), and Advanced Micro Devices (AMD). The biggest detractors were Cencora (COR) and Walmart (WMT).
During the month the Fund exited positions in TKO Group Holdings Inc (TKO), Cencora Inc (COR), Home Depot (HD), Intuit (INTU), Robinhood Markets (HOOD) and Tempus AI (TEM). Positions were initiated in Circle Internet Group (CRCL), GE Vernova (GEV), Twilio (TWLO) and Iridium Communications (IRDM). QDVO ended the month with a total of 10 covered calls written representing approximately 29% coverage of the notional value of the portfolio.2
The performance data quoted represents past performance and does not guarantee future results. Investment return and principal value of an investment will fluctuate so that an investor’s shares, when sold or redeemed, may be worth more or less than the original cost. Current performance may be lower or higher than the performance quoted. For most recent month-end performance, visit QDVOETF.com.
YIELD
| Distribution Frequency: Monthly |
Distribution Rate: 11.01% |
30-Day SEC Yield: 0.36% |
Distribution Rate is the normalized current distribution (annualized) over NAV per share. Distributions may include income, capital gains, or return of capital and may change during the year. Details are provided in the Fund's Form 19(a)-1. There is no guarantee the ETF will pay a distribution. 30-Day SEC Yield is a standard yield calculation developed by the Securities and Exchange Commission that allows for fairer comparisons among bond funds. It is based on the most recent month end. This figure reflects the income earned from dividends – excluding option income – during the period after deducting the Fund’s expenses for the period.
PERFORMANCE
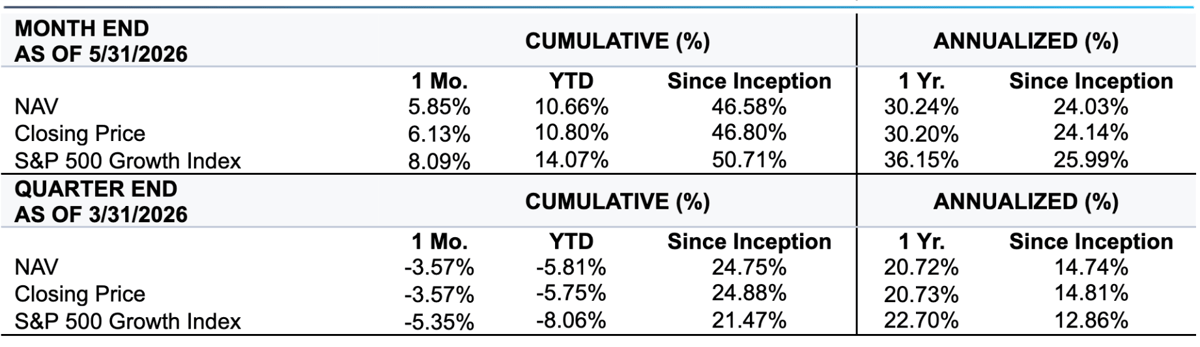
Fund inception date: 8/21/2024. QDVO’s total expense ratio is 0.56%. The performance data quoted represents past performance and does not guarantee future results. Investment return and principal value of an investment will fluctuate so that an investor's shares, when sold or redeemed, may be worth more or less than the original cost. Current performance may be lower or higher than the performance quoted. For most recent month-end performance, visit AmplifyETFs.com/QDVO. Brokerage commissions will reduce returns. NAV is the sum of all its assets less any liabilities, divided by the number of shares outstanding. The closing price is the last price at which the fund traded.
SECTORS
| Sector | % Weight |
TOP 10 HOLDINGS
| Ticker | Name | % Weight |
All data as of 5/31/2026. Subject to change at any time. Fund holdings should not be considered recommendations to buy or sell any security. View Current Complete Holdings.