



Markets advanced despite ongoing uncertainty around rates, tariffs, and global growth.
Despite ongoing uncertainty surrounding oil prices, Federal Reserve policy, new tariffs affecting global trade, and interest rates at their highest levels in decades, a number of positive factors pushed broad market indices upward.
For investors, the central takeaway is that short-term concerns are a routine feature of markets. Rather than attempting to respond to each challenge as it arises, history demonstrates that portfolios built with long-term goals in mind have offered the best probability of financial success. With that context established, what were the key drivers of markets in August, and what should investors be thinking about going forward?
Key Market and Economic Drivers in August
-
The S&P 500, Nasdaq, and Dow Jones Industrial Average rose 2.6%, 3.9%, and 1.3%, respectively, in August. Year-to-date, they have gained 12.3%, 13.5%, and 10.7%, respectively.
-
Volatility, as measured by the CBOE VIX index, dropped below the long-term average, ending the month at 16 after climbing as high as 21 the previous month.
-
International developed markets returned 1.8% based on the MSCI EAFE Index in U.S. dollar terms, while emerging markets returned 3.2% based on the MSCI EM Index.
-
The 30-year Treasury yield reached its highest level since 2007, closing the month at 5.24%. The 10-year Treasury yield ended the month at 4.75%. The Bloomberg U.S. Aggregate Bond Index returned 0.4% for the month.
-
Oil prices hovered in a range in August after climbing the previous month. Brent crude closed the month at $90.68 per barrel and WTI near $86.27 per barrel.
-
The U.S. Dollar Index fell to 99.43 at the end of August. Gold ended the month at $4,437.38 per ounce while silver rose to $66.58 per ounce.
-
The revision to second quarter GDP remained unchanged at an annual rate of 1.5%.
-
The July jobs report missed expectations with a decline of -23,000 in payrolls compared to a forecasted gain of 80,000. Unemployment fell slightly to 4.1%.
Long-term yields remain near their highest levels in decades
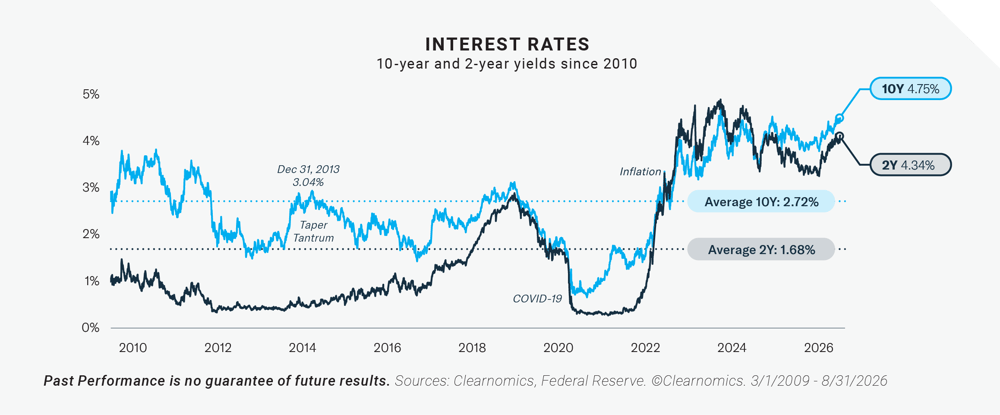
One of the most defining characteristics of today’s investment environment is that interest rates have stayed higher than most observers anticipated. The 30-year Treasury yield briefly exceeded 5.3% in August, a level not seen in nearly 20 years. Similarly, the 10-year Treasury yield, at around 4.8%, is approaching its recent peak.1
While interest rates can appear to be a technical matter, they both influence and reflect the broader state of the economy. Higher rates are commonly viewed as a headwind for markets, but the reason behind the increase matters considerably. While inflation pushed rates higher over the past several years, more recent rate increases have been driven by improvements in “real yields.” This means that inflation-adjusted yields have risen, signaling that the economy continues to expand, supported by strong corporate earnings. Over the long run, this is a constructive signal for market health, which helps explain why interest rates and stock prices are both near elevated levels simultaneously.
Looking ahead, elevated rates can also benefit long-term investors by generating income across bond holdings. At the same time, rising rates place downward pressure on the prices of existing bonds, which has contributed to major bond indices such as the Bloomberg U.S. Aggregate Bond Index remaining essentially flat this year. It is therefore important to consider rising rates within the context of a well-diversified portfolio and in relation to individual financial goals.
Inflation, however, continues to run above levels that consumers and policymakers find comfortable. The headline Personal Consumption Expenditures Price Index showed that inflation stood at 3.7% year-over-year in July, while core PCE rose 3.3%, both meaningfully above the Fed’s 2% target.2
At the Fed’s annual Jackson Hole symposium in late August, Fed Chair Kevin Warsh signaled that a rate hike could arrive sooner than expected. As a result, markets are now pricing in at least one rate hike this year, and possibly two by early next year.3
Corporate earnings growth is broad-based across sectors
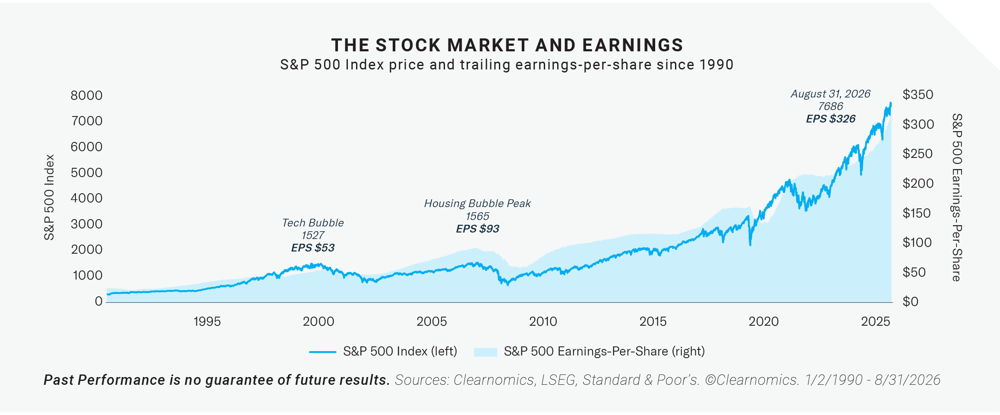
The S&P 500 reached new all-time highs in August, a move largely attributable to strong corporate earnings. Second quarter results came in well ahead of expectations across a wide range of sectors, and consensus estimates now place S&P 500 earnings at $349 per share by year-end. These projections also call for earnings-per-share growth of 15% in each of the next two years, which is well above the historical average of 7%.4
These figures largely reflect growth driven by AI infrastructure investment, higher oil prices, and healthy expansion across multiple sectors. Notably, ten of the eleven S&P 500 sectors reported year-over-year earnings growth, with nine of those sectors posting double-digit percentage gains. This breadth of growth suggests that the broader economy, not just a handful of large companies, is contributing to overall corporate profitability.5
Strong earnings have been one reason that broad stock market valuations have held relatively steady over the past year. The S&P 500 price-to-earnings ratio has remained near 20x, which is well above the historical average of 16x but an improvement from recent peaks. While valuations do not offer precise short-term guidance, they serve as meaningful indicators for long-term asset allocation. In an environment of elevated valuations, maintaining balance across sectors, asset classes, and geographies remains especially important.
Trade policy continues to create uncertainty for global markets
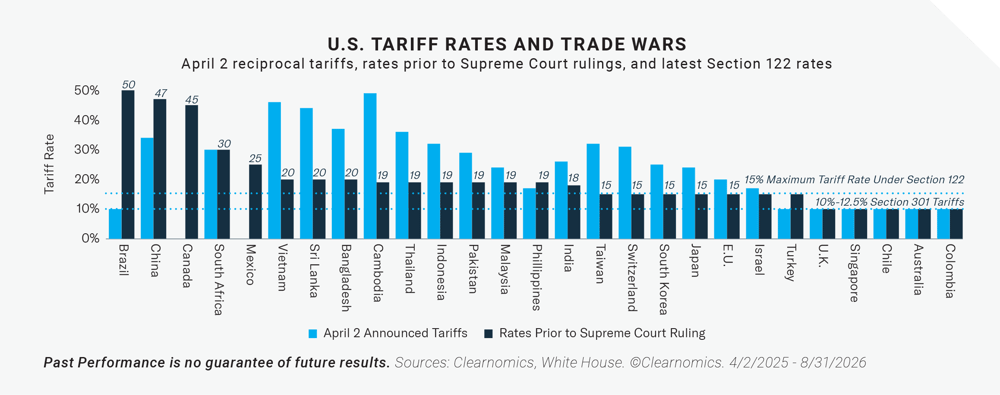
Trade policy returned to the forefront in August as tensions with key trading partners, including Canada, intensified. Following last year’s “Liberation Day” tariffs being ruled illegal by the Supreme Court in February, new tariffs were put in place under alternative legal frameworks such as Section 301 of the Trade Act of 1974. Those tariffs have since expired, leading to the introduction of additional tariffs under separate trade laws, each carrying its own set of rules. Concurrently, the government has begun refunding the original “reciprocal tariffs” to businesses, with $129 billion already accepted for processing by U.S. Customs and Border Protection.6
As has been the pattern since early last year, the most severe outcomes that many investors and economists anticipated have not materialized. This is largely because companies have adapted their supply chains, revised pricing strategies, and managed costs in response to these tariffs, reducing the inflationary impact of higher intermediate prices. Even so, tariffs are likely to remain a source of uncertainty for global markets in the years ahead.
|
The Bottom Line? August demonstrated the importance of staying balanced and not overreacting to headlines. Despite periods of volatility, strong corporate earnings and attractive bond yields have continued to support long-term portfolios. |
1https://home.treasury.gov/policy-issues/financing-the-government/interest-rate-statistics
2https://www.bea.gov/news/2026/personal-income-and-outlays-july-2026
3https://www.cmegroup.com/markets/interest-rates/cme-fedwatch-tool.html
4Clearnomics research and LSEG data as of August 31, 2026
5https://insight.factset.com/sp-500-earnings-season-update-august-7-2026
6https://www.cbp.gov/trade/programs-administration/trade-remedies/ieepa-duty-refunds
Indexes are unmanaged and it’s not possible to invest directly in an index. The S&P 500 Total Return Index is a market-capitalization weighted index of the 500 largest U.S. publicly traded companies. Nasdaq Composite Index tracks the value of most stocks listed on the Nasdaq exchange. CBOE Volatility Index (VIX) is a measure of implied volatility, based on the prices of a basket of S&P 500 Index options with 30 days to expiration. Dow Jones Industrial Average is comprised of 30 stocks that are major factors in their industries and widely held by individuals and institutional investors. MSCI EAFE Index is designed to measure the equity market performance of developed markets outside the U.S. and Canada. MSCI Emerging Markets (EM) Index is designed to measure large- and midcap representation across emerging market countries. Bloomberg U.S. Aggregate Bond Index is designed to measure the performance of the U.S. investment grade bond market. 10-year Treasury is represented by the Bloomberg US Treasury Bellwethers 10 Year Index that measures the on-the-run (most recently auctioned) U.S. Treasury bond with 10 years’ maturity. Bloomberg Commodities Index measures the performance of the global commodities market through a basket of futures contracts across energy, metals, agriculture, and livestock. Diversification does not assure a profit, nor does it protect against loss of principal.
Carefully consider the Fund’s investment objectives, risks, charges, and expenses before investing. This and other information can be found in the Fund’s statutory and summary prospectuses, which may be obtained at AmplifyETFs.com. Read the prospectus carefully before investing.
Investing involves risk, including the possible loss of principal. Shares of any ETF are bought and sold at market price (not NAV), may trade at a discount or premium to NAV and are not individually redeemed from the Fund. Brokerage commissions will reduce returns.
Amplify ETFs are distributed by Foreside Fund Services, LLC.