



Volatility Returns, but the Broader Trend Endures.
July proved to be a difficult month for markets, with major indices finishing slightly in the red. That said, this pullback comes against a backdrop of solid year-to-date gains, and the broader market remains not far from its all-time high. Several factors shaped daily market movements throughout the month, including fresh concerns about AI spending, Treasury yields pushing toward multi-year highs, oil prices climbing after a breakdown in the Middle East ceasefire, and the Federal Reserve opting to hold rates steady.
Many of these developments reflect longer-term themes that could continue to generate volatility in the months ahead. At the same time, these same trends have helped propel markets higher this year, underscoring the value of portfolio balance and a longer-term perspective. What can investors take away from July as they look toward the remainder of the year?
Key Market and Economic Drivers in July
-
The S&P 500 and Nasdaq declined -0.1% and -3.2%, respectively, while the Dow Jones Industrial Average rose 0.3% in July.
-
Volatility jumped in the middle of the month with the VIX index climbing as high as 21 before settling back toward 16.
-
International developed markets returned 1.9% based on the MSCI EAFE Index in U.S. dollar terms, while emerging markets fell -3.3% based on the MSCI EM Index.
-
The 30-year Treasury yield surged to a 19-year high to close around 5.28% and the 10-year Treasury yield ended the month at a peak of 4.74%. The Bloomberg U.S. Aggregate Index fell -1.3%.
-
Oil prices rose with Brent crude climbing above $100 before closing at $90 per barrel and WTI at $85 per barrel.
-
The U.S. Dollar Index (DXY) fell just under 100 while the Japanese Yen depreciated significantly, closing around 157. Gold ended the month approximately unchanged at about $4,050 per ounce.
-
Second quarter real GDP growth increased at an annual rate of 1.5%, down from the 2.1% growth recorded in the first quarter of the year.
-
At the July FOMC meeting, the Federal Reserve decided to keep rates unchanged at 3.50%-3.75% in a 9-3 vote.
AI investment fuels mixed results across the tech sector
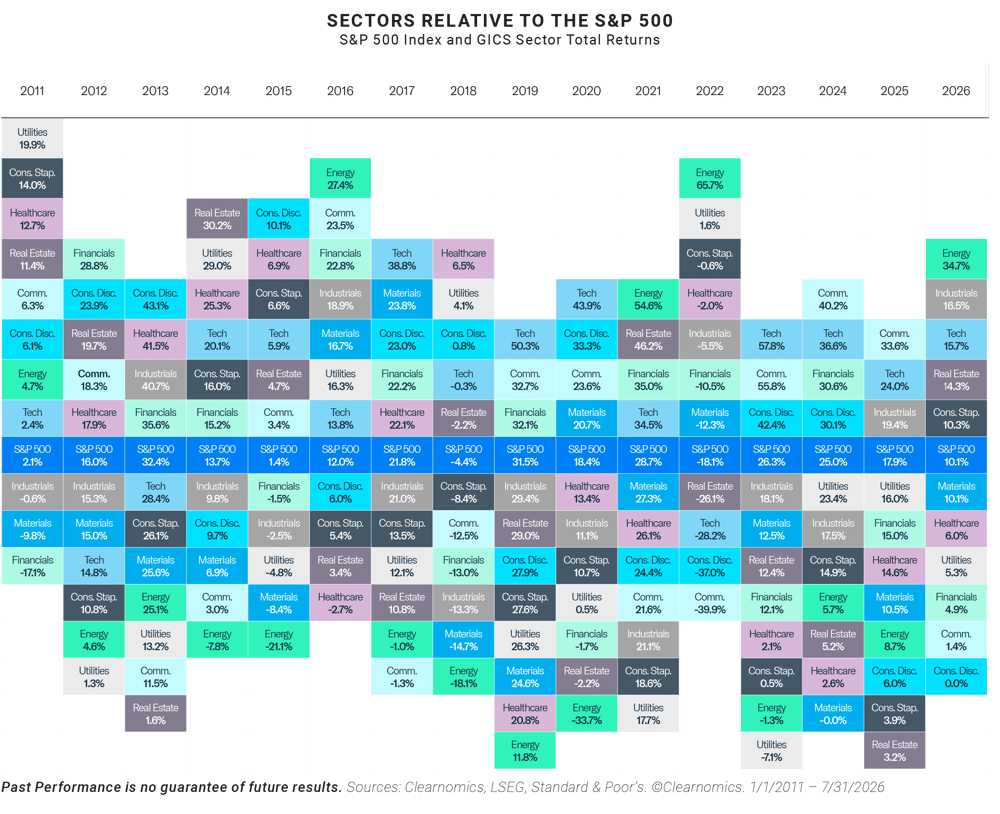
Second quarter corporate earnings reports brought new scrutiny to AI investments and sparked notable market swings. Investor concern centered on the free cash flow of large technology companies, commonly referred to as “hyperscalers,” which continue to pour hundreds of billions of dollars into data center construction and AI infrastructure. Markets are closely watching whether these enormous capital expenditures will ultimately translate into meaningful profits. Notably, spending on data centers alone has grown into a significant contributor to U.S. economic activity, surpassing all other categories of office construction.1
The scale of these investments is also rippling into international markets, particularly among global semiconductor companies. Major chip suppliers experienced sharp corrections during the month, contributing to a 24% decline in the South Korean KOSPI 200 index in July, following a significant run-up in 2025. This illustrates that while AI remains a powerful market theme, it also brings periods of meaningful volatility.
A notable AI development in July was the launch of a new large language model, Kimi K3, by the Chinese company Moonshot AI.2 This model reportedly competes with the most advanced models from companies such as OpenAI, Anthropic, and Alphabet. It is also “open weight,” meaning that anyone with the right hardware can run the model themselves, in contrast to most frontier models which are proprietary.
While last year’s DeepSeek models demonstrated that AI models could be built more efficiently, Kimi K3 signals that newer open models can rival cutting-edge proprietary ones. This introduces further uncertainty about the trajectory of the AI industry, spanning both hardware and infrastructure requirements, as well as which country will lead the next phase of AI development.3
|
|
For long-term investors, it is worth remembering that AI is just one of many factors driving market performance. The chart above highlights that other sectors, including Energy, Industrials, and more, have also performed well this year. As markets continue to assess the long-term economic impact of AI, maintaining a balanced approach across sectors and asset classes remains important.
Middle East conflict briefly pushes oil back above $100
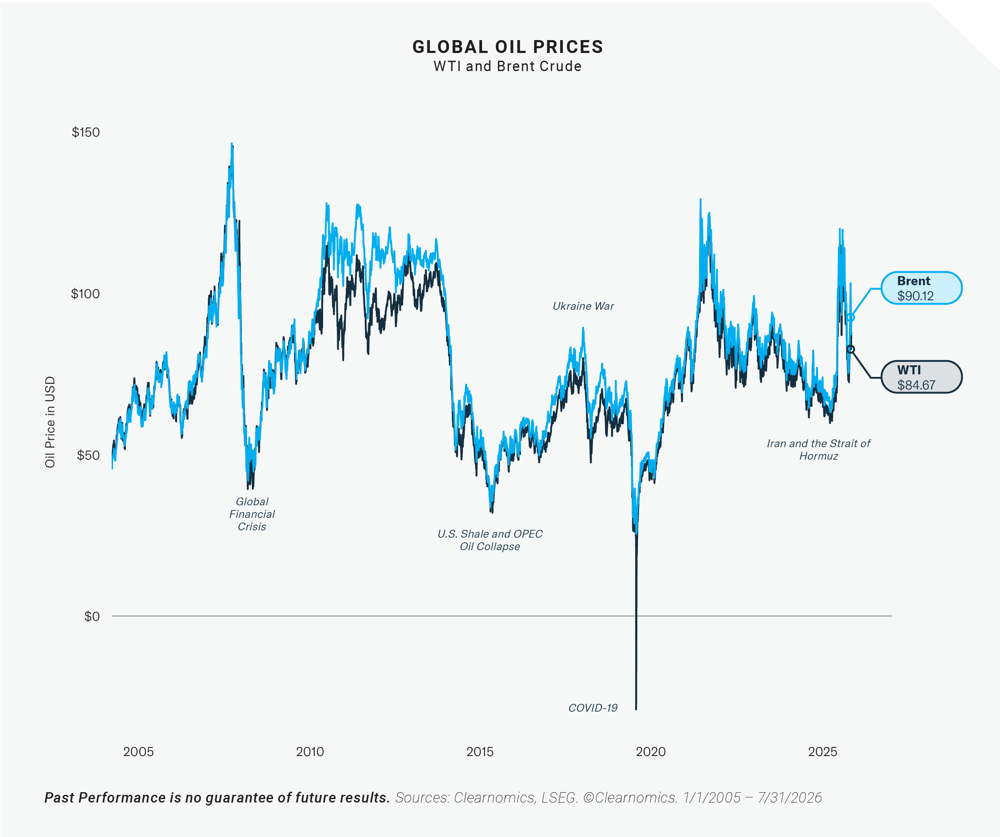
The ongoing conflict in Iran contributed to short-term market disruptions during July. Tensions escalated mid-month after the U.S. conducted additional airstrikes against Iranian military sites, slowing traffic through the Strait of Hormuz, a critical chokepoint for global oil supply. The conflict broadened when Yemen’s Houthi forces struck Saudi Arabian oil tankers in the Bab al-Mandeb Strait in the Red Sea, drawing another key waterway into the conflict.3
In response, Brent crude briefly surpassed $100 per barrel before retreating to approximately $90 by month-end. For context, oil had fallen as low as $72 per barrel earlier in July. Elevated energy prices carry broad economic consequences, as they directly increase fuel costs for both households and businesses. Gasoline prices remain around $4.10 per gallon nationally, a level that could keep headline inflation elevated.4
The Federal Reserve holds rates amid a divided committee
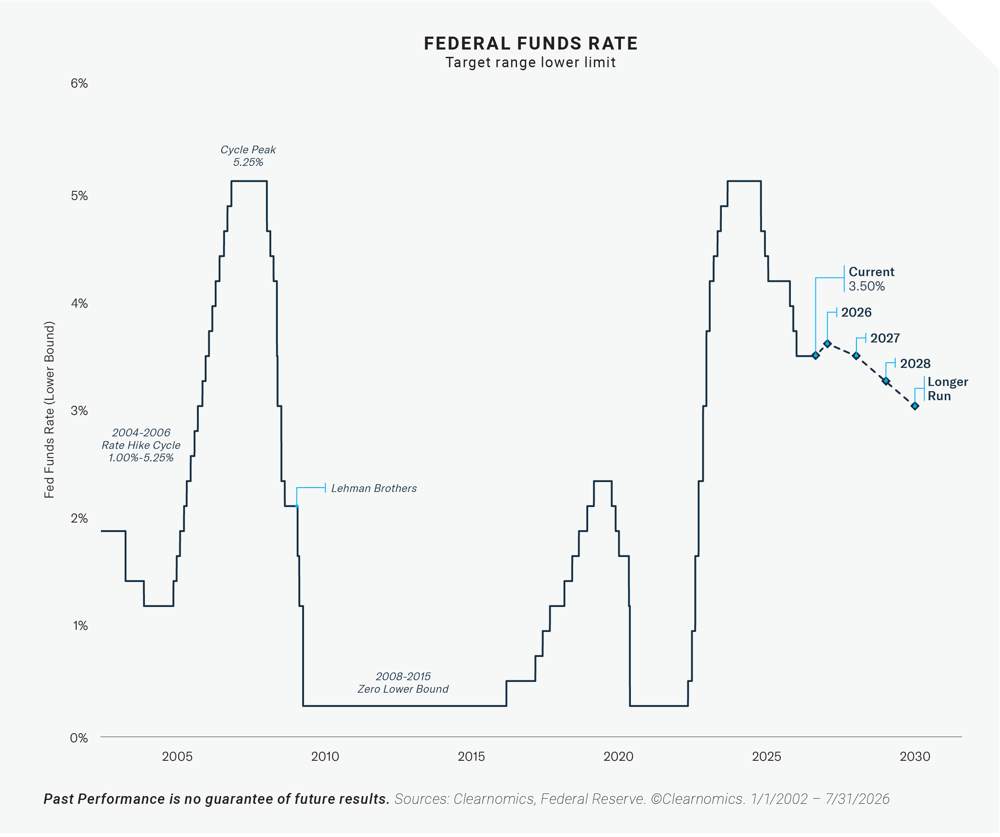
At its July meeting, the Federal Open Market Committee (FOMC) opted to keep the federal funds rate unchanged within a range of 3.50% to 3.75%, even as inflation concerns persisted.5 This decision contributed to additional market volatility as bond yields rose and investors worked to assess the likelihood of future rate increases.
New Fed Chair Kevin Warsh has deliberately reduced the level of communication regarding how the Fed may act at future meetings and declined to address how the Fed might respond to various economic scenarios. The market’s reaction to this reduced “forward guidance” was a rise in bond yields, with both nominal and real Treasury rates climbing to their highest levels in recent years.
For investors, uncertainty around Fed policy could translate into greater volatility in yields. At the same time, higher yields present potential opportunities for portfolio diversification.
New tariffs add more economic uncertainty
New tariffs introduced additional complexity to the economic environment in July. After the Supreme Court ruled that last year’s reciprocal tariffs under the International Emergency Economic Powers Act were illegal, the administration responded by implementing new tariffs under a separate trade law, Section 122 of the Trade Act of 1974. Those tariffs expired in July, prompting the White House to implement further tariffs under different trade rules.
The net result is that many countries now face tariffs ranging from 10% to 12.5%. Certain countries face considerably higher rates, including a 50% tariff on specific Canadian goods such as cement, dairy, and alcohol. These tariffs were introduced under Section 338 of the Tariff Act of 1930, citing what the administration described as discriminatory treatment of American products.6
As is typically the case, the full economic effects of these tariff measures will take time to become apparent. For long-term investors, a key observation is that many of the market and economic concerns stemming from tariffs have not materialized to the extent some had anticipated. While tariffs do affect specific industries and consumer prices, companies have the ability to adapt and adjust their pricing strategies over time. In fact, the economy has continued to grow steadily and the S&P 500 has reached multiple new all-time highs over the past year.
|
The Bottom Line? July reinforced the importance of keeping a long-term perspective. Market challenges can create opportunities for investors who are positioned across different asset classes. Staying focused on the bigger picture, rather than reacting to the news headlines, remains key to pursuing long-term financial goals. |
1https://www.census.gov/construction/c30/c30index.html
2https://forum.moonshot.ai/t/kimi-k3-is-here-our-most-capable-model/480
3https://apnews.com/article/yemen-saudi-houthis-attack-shipping-red-sea-4e25fbdad821762e478173e6308884fb
4https://gasprices.aaa.com/
5https://www.federalreserve.gov/newsevents/pressreleases/monetary20260729a.htm
6https://www.whitehouse.gov/fact-sheets/2026/07/fact-sheet-president-donald-j-trump-imposes-additional-tariffs-on-canada/
Indexes are unmanaged and it’s not possible to invest directly in an index. The S&P 500 Total Return Index is a market-capitalization weighted index of the 500 largest U.S. publicly traded companies. CBOE Volatility Index (VIX) is a measure of implied volatility, based on the prices of a basket of S&P 500 Index options with 30 days to expiration. Dow Jones Industrial Average is comprised of 30 stocks that are major factors in their industries and widely held by individuals and institutional investors. MSCI EAFE Index is designed to measure the equity market performance of developed markets outside the U.S. and Canada. MSCI Emerging Markets (EM) Index is designed to measure large- and mid-cap representation across emerging market countries. Bloomberg U.S. Aggregate Bond Index is designed to measure the performance of the U.S. investment grade bond market. 10-year Treasury is represented by the Bloomberg US Treasury Bellwethers 10 Year Index that measures the on-the-run (most recently auctioned) U.S. Treasury bond with 10 years’ maturity. Bloomberg Commodities Index measures the performance of the global commodities market through a basket of futures contracts across energy, metals, agriculture, and livestock. Diversification does not assure a profit, nor does it protect against loss of principal.
Carefully consider the Fund’s investment objectives, risks, charges, and expenses before investing. This and other information can be found in the Fund’s statutory and summary prospectuses, which may be obtained at AmplifyETFs.com. Read the prospectus carefully before investing.
Investing involves risk, including the possible loss of principal. Shares of any ETF are bought and sold at market price (not NAV), may trade at a discount or premium to NAV and are not individually redeemed from the Fund. Brokerage commissions will reduce returns.
Amplify ETFs are distributed by Foreside Fund Services, LLC.